
- Moving the Markets
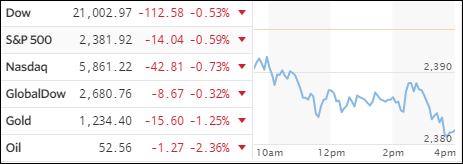
While the jury is still out in regards to me considering yesterday’s market ramp a “blow-off” top, today’s pullback did not come as a surprise with the major indexes having been on 12-day parabolic rampage supported by not a lot of real news to justify it.
Of course, today could have been a simple case of profit taking, which has been long overdue. Consider that ever since the election, any kind of selling has been met with relentless buying pushing stocks to new records highs for days on end, without as much as a 1% correction in over 90 trading days.
Today’s pullback took back about 50% of yesterday’s gains. In summary, interest rates rose and bonds got clobbered; gold got hammered while the US dollar rallied. Rate hike odds surged to 90% after the Fed mouthpieces Brainard, Williams, Dudley and Kaplan jawboned hawkish statements. Translation: It’s almost certain that a hike in March will happen when the Fed meets on March 15. But you never know for sure, so let’s wait and see if they actually follow through or if they start walking back market expectations—again.
- ETFs in the Spotlight (updated for 2017)
In case you missed the announcement and description of this section, you can read it here again.
It features 10 broadly diversified and sector ETFs from my HighVolume list as posted every Saturday. Furthermore, they are screened for the lowest MaxDD% number meaning they have been showing better resistance to temporary sell offs than all others over the past year.
The below table simply demonstrates the magnitude with which some of the ETFs are fluctuating in regards to their positions above or below their respective individual trend lines (%M/A). A break below, represented by a negative number, shows weakness, while a break above, represented by a positive percentage, shows strength.
For hundreds of ETF choices, be sure to reference Thursday’s StatSheet.
Year to date, here’s how the 2017 candidates have fared so far:
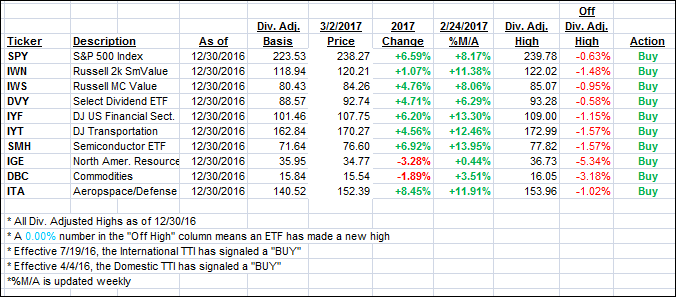
Again, the %M/A column above shows the position of the various ETFs in relation to their respective long term trend lines, while the trailing sell stops are being tracked in the “Off High” column. The “Action” column will signal a “Sell” once the -7.5% point has been taken out in the “Off High” column.
- Trend Tracking Indexes (TTIs)
Our Trend Tracking Indexes (TTIs) followed the general trend and closed lower.
Here’s how we closed 3/2/2017:
Domestic TTI: +2.95% (last close +3.30%)—Buy signal effective 4/4/2016
International TTI: +5.58% (last close +6.00%)—Buy signal effective 7/19/2016
Disclosure: I am obliged to inform you that I, as well as my advisory clients, own some of the ETFs listed in the above table. Furthermore, they do not represent a specific investment recommendation for you, they merely show which ETFs from the universe I track are falling within the guidelines specified.
Contact Ulli