Do you want to know which ETFs are hot and which ones are not? Then you need my High-Volume ETF Cutline report. It tells you how close or far each of the 311 ETFs I follow is from its long-term trend line (39-week SMA). These are the ETFs that trade more than $5 million a day, so they are not some obscure funds that nobody cares about.
The report is split into two parts: The winners that are above their trend line (%M/A), and the losers that are below it. The yellow line is the line of shame that separates them. You can see how many ETFs are in each group and how they have changed since the last report (290 vs. 266 current).
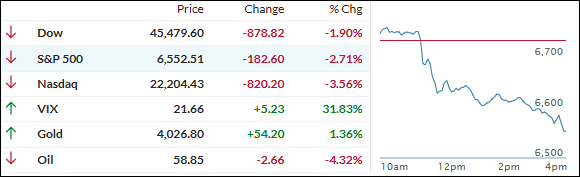
RARE EARTH FIGHT SENDS MARKETS TUMBLING, GOLD AND SILVER RALLY
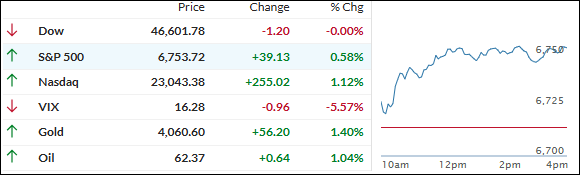
[Chart courtesy of MarketWatch.com]
Moving the market
Stocks started off on the right foot today, with the S&P 500 and Nasdaq building on the week’s gains—the Nasdaq even notched a new all-time intraday high.
But the mood changed in a hurry after President Trump threatened hefty new tariffs on China, accusing them of being “very hostile” with their rare earth metals restrictions—a major shot across the bow for tech and defense companies.
The drop picked up steam all the way into the close, especially after Trump announced he was scrapping a planned meeting with President Xi and floated a “massive” tariff bump as payback for what he described as China holding the globe “captive” with rare earth controls.
China had already tightened those controls this week, requiring foreign buyers to get a special license from Beijing for products containing as little as 0.1% rare earths. Suddenly, any hope for a near-term China trade deal vanished in record time.
Almost lost in the shuffle, the government shutdown dragged on for a tenth day after the Senate failed—again—to break its deadlock. No real progress on talks, and the lack of fresh economic data isn’t helping traders find direction. At least the University of Michigan’s latest read on the economy and consumer was upbeat.
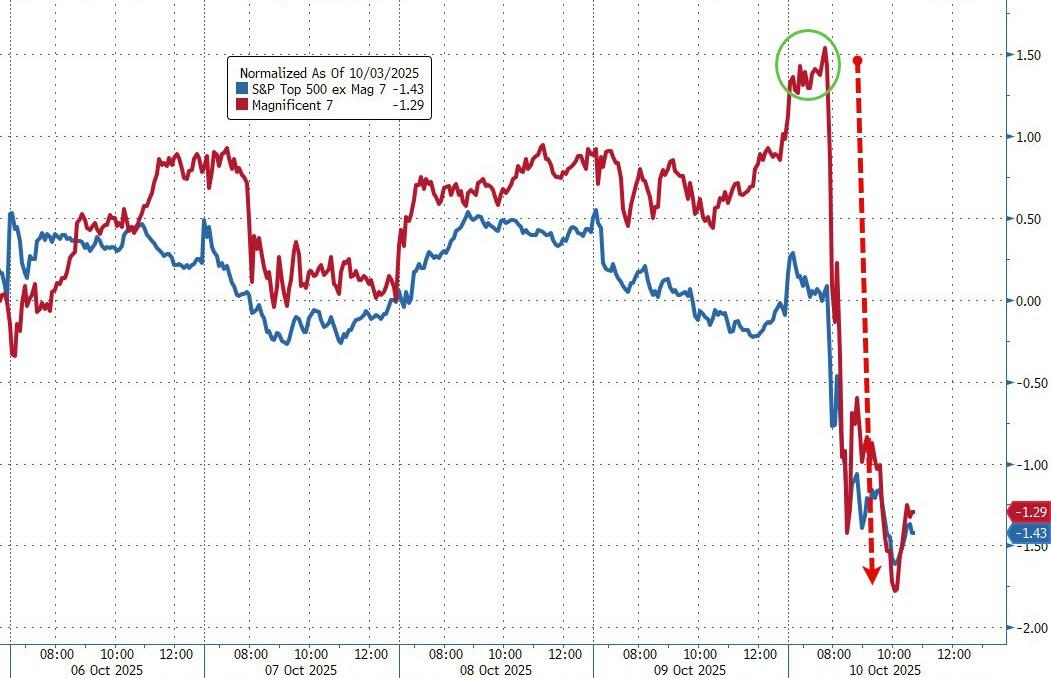
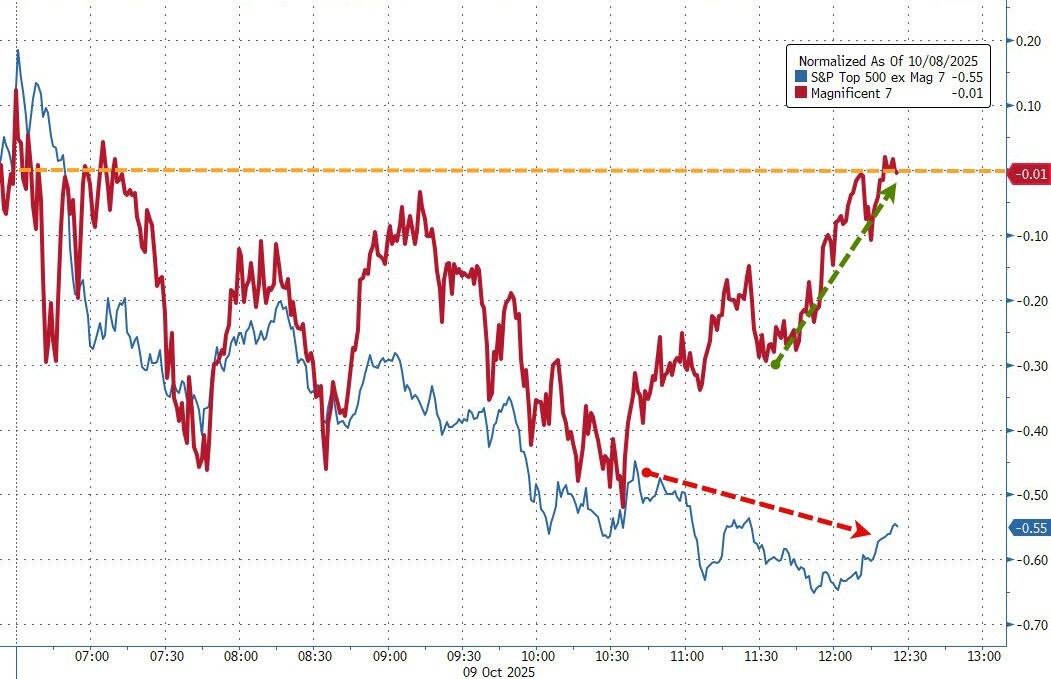
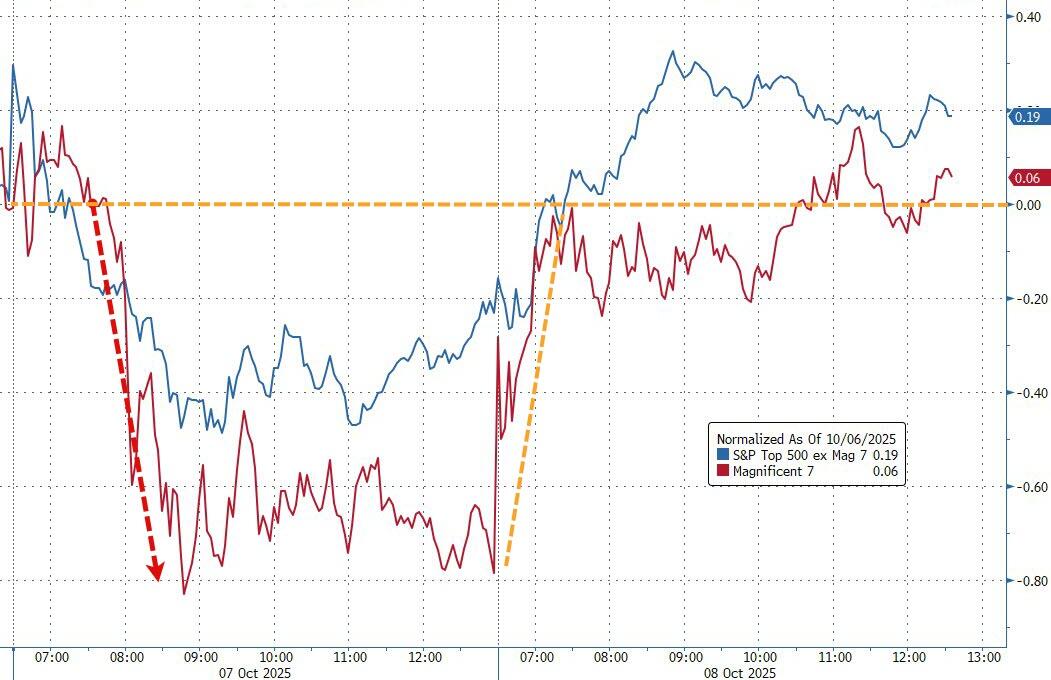
Today, the “Mag 7” and the rest of the S&P 500 dropped in sync, all ending the week with sharp losses and posting the first 1%+ drop in 48 trading days.
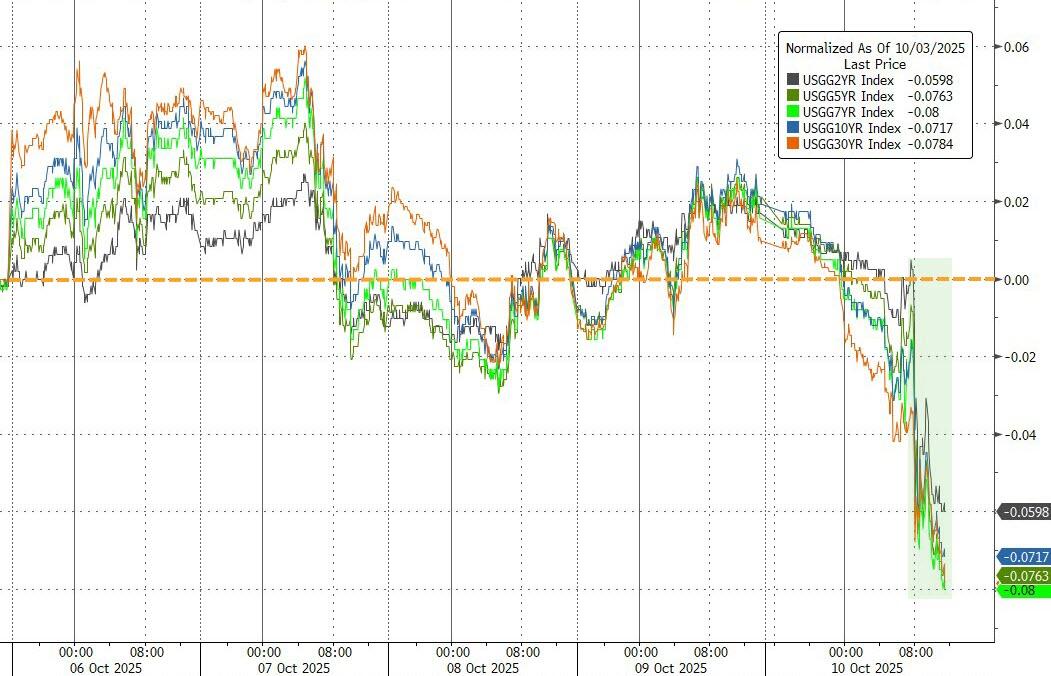
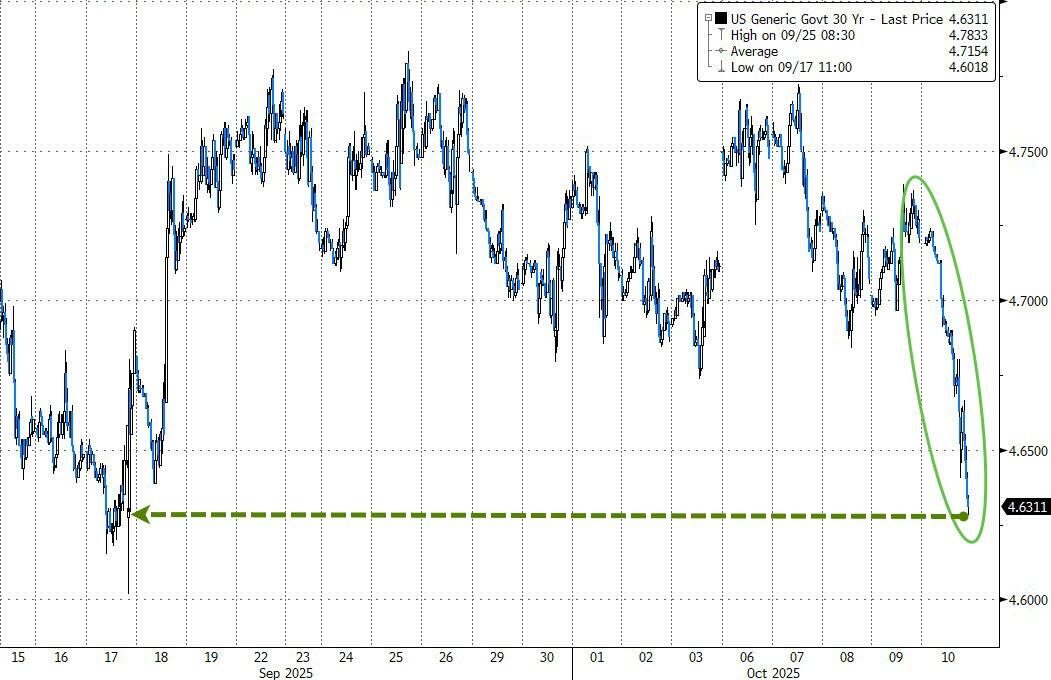
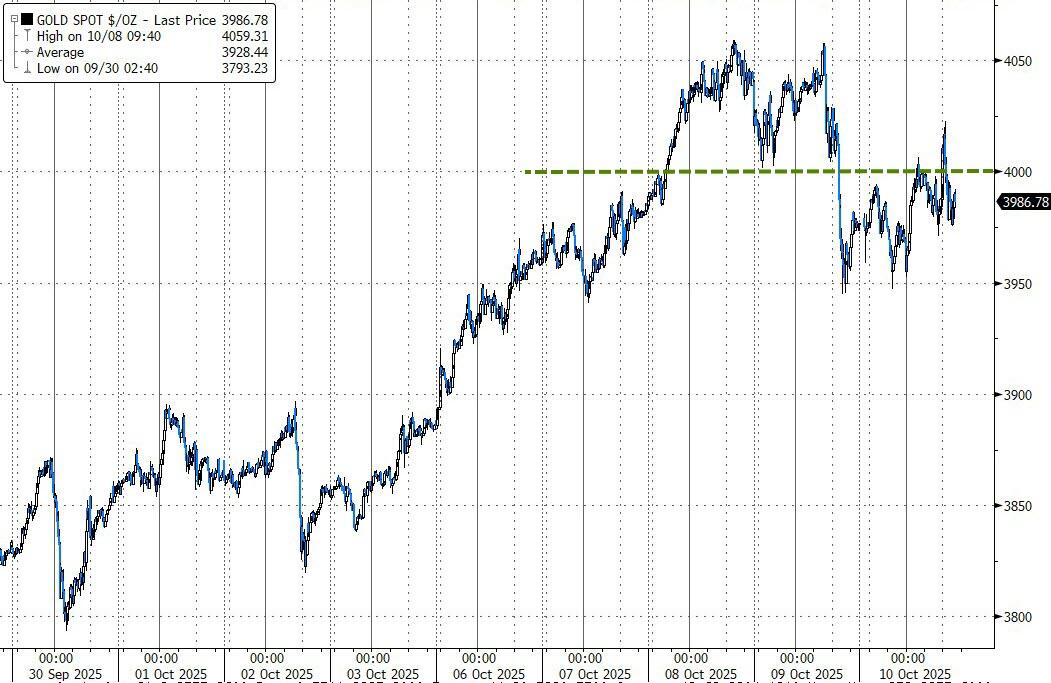
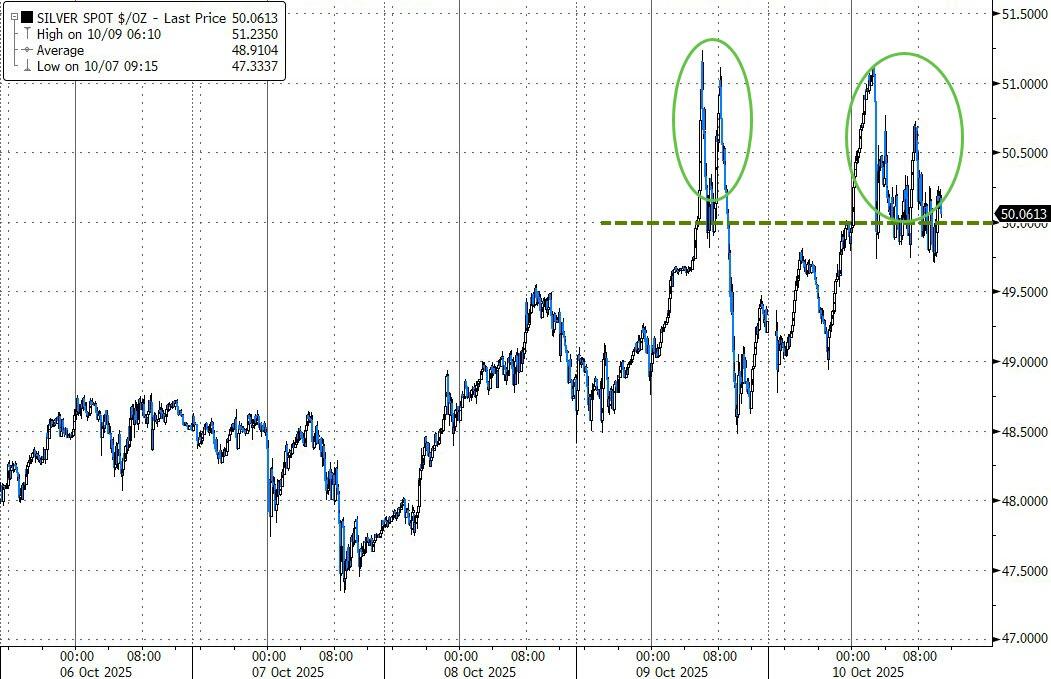
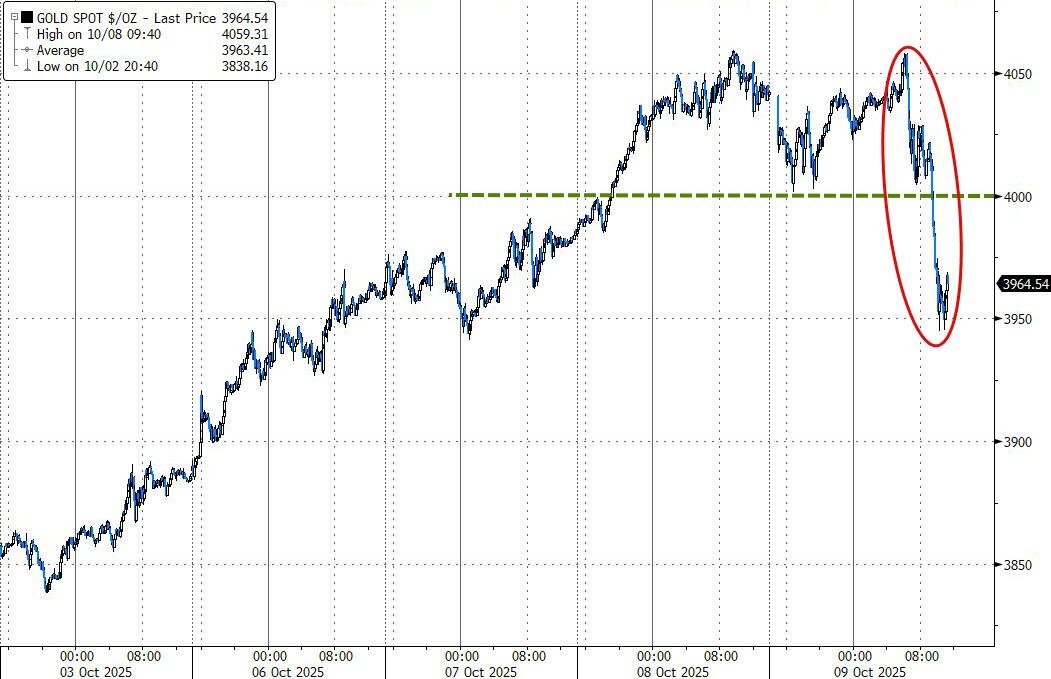
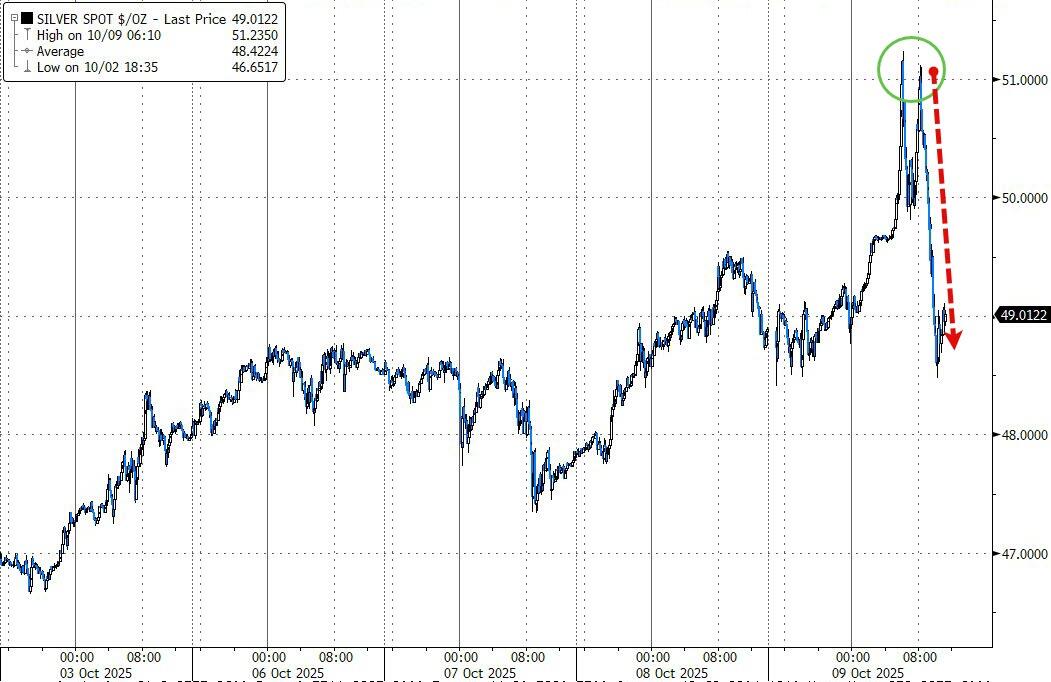
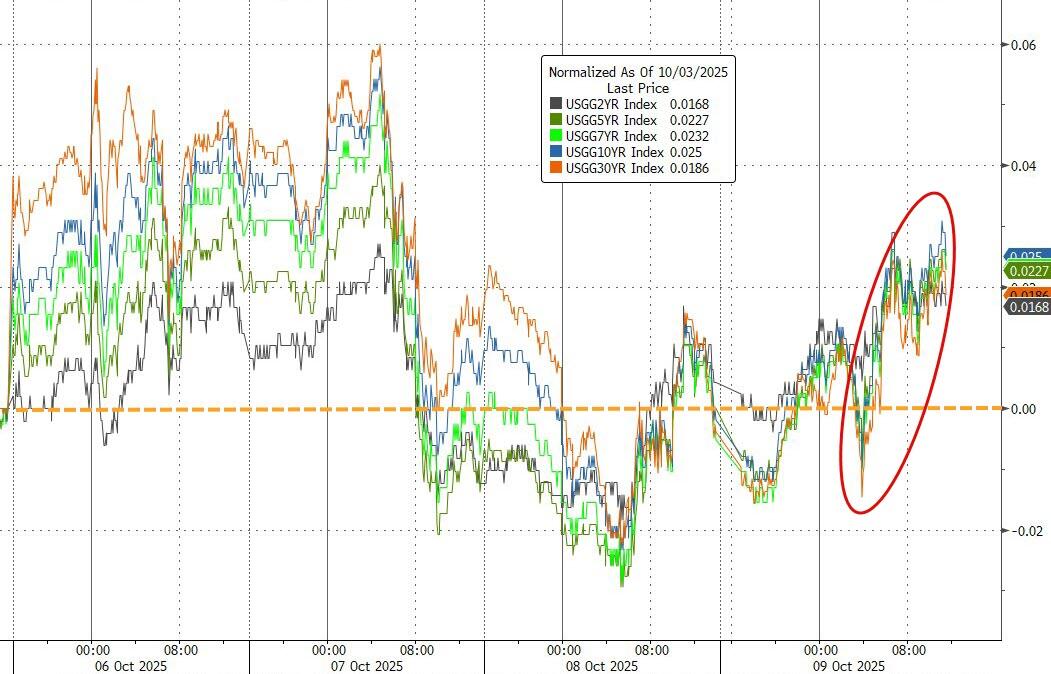
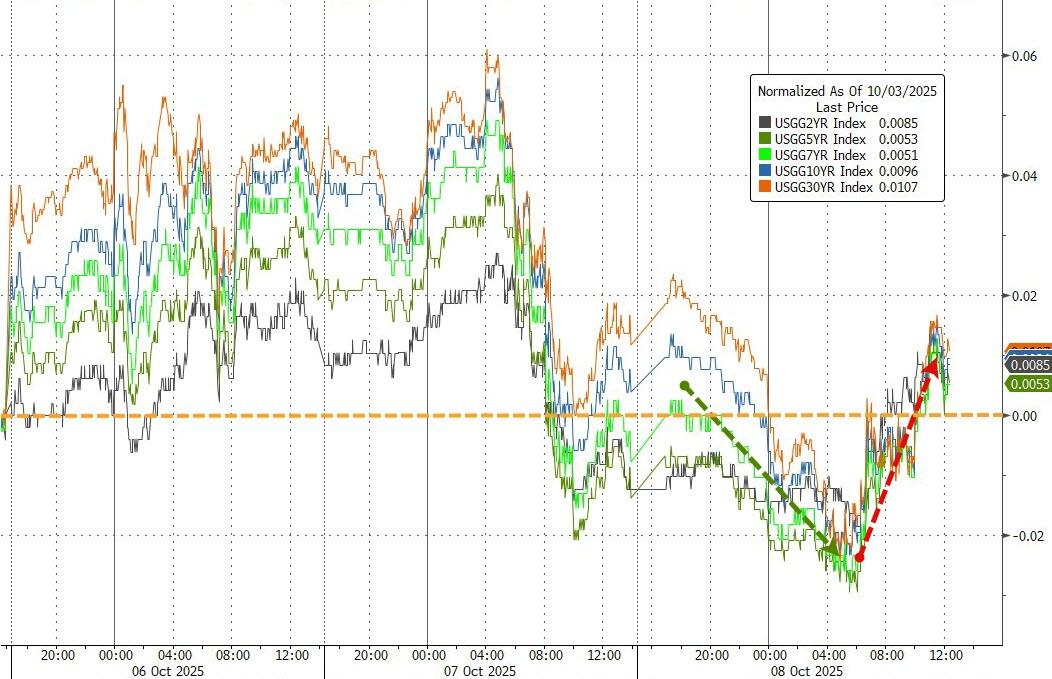
Bond yields softened, with the 30-year Treasury at a three-week low, but there was a silver lining: gold rallied for an eighth straight week, closing above $4,000, and silver followed with its own winning streak thanks to tight European physical markets.
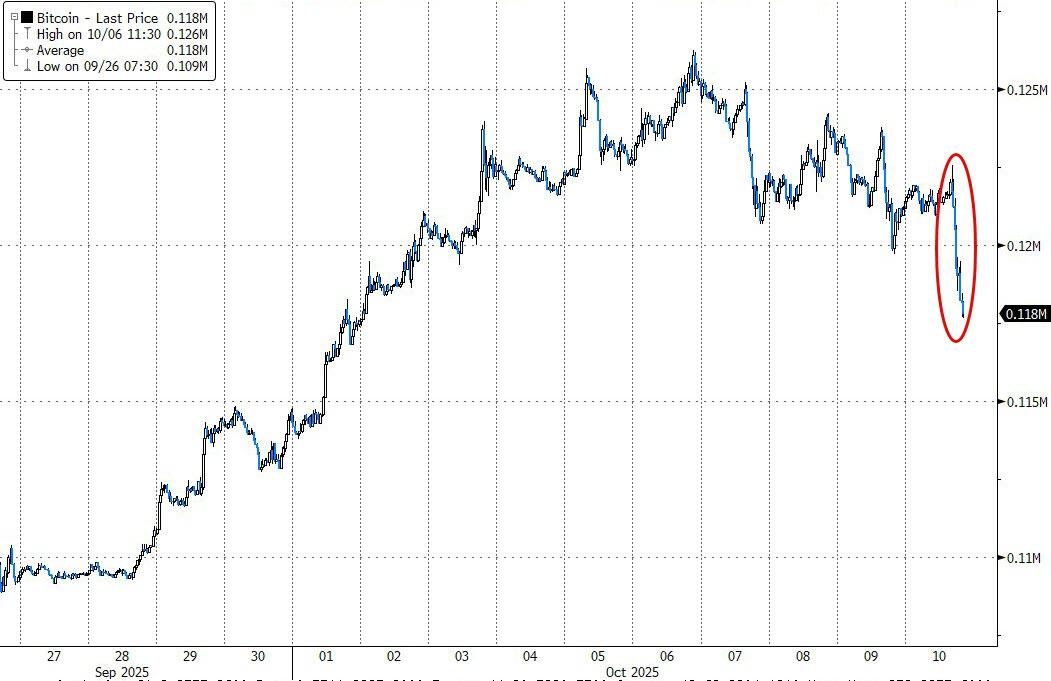
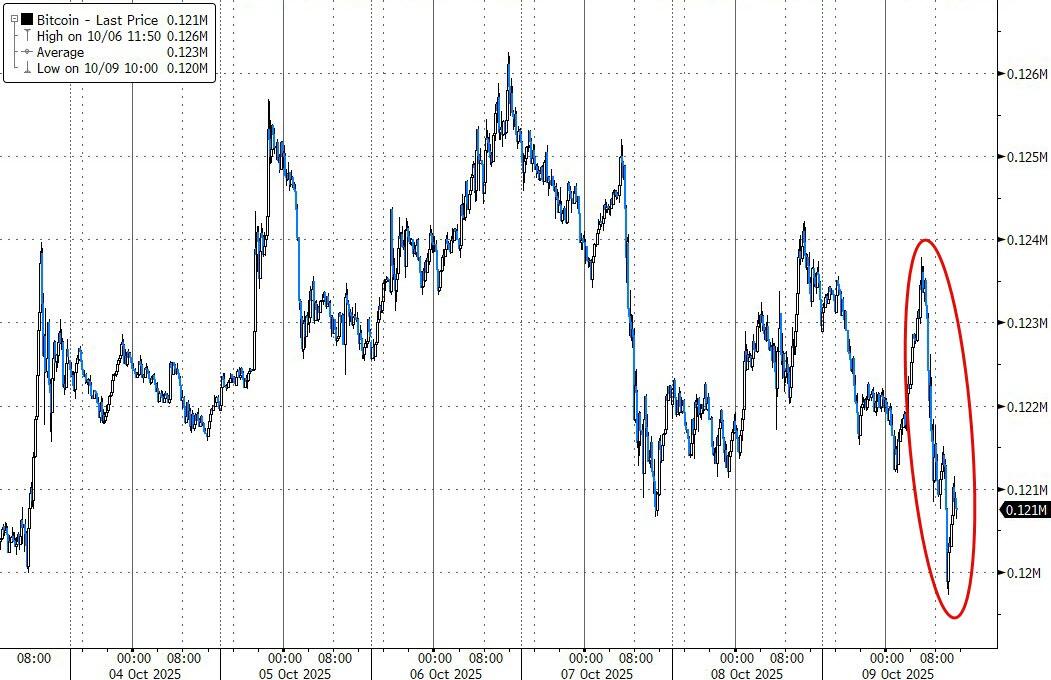
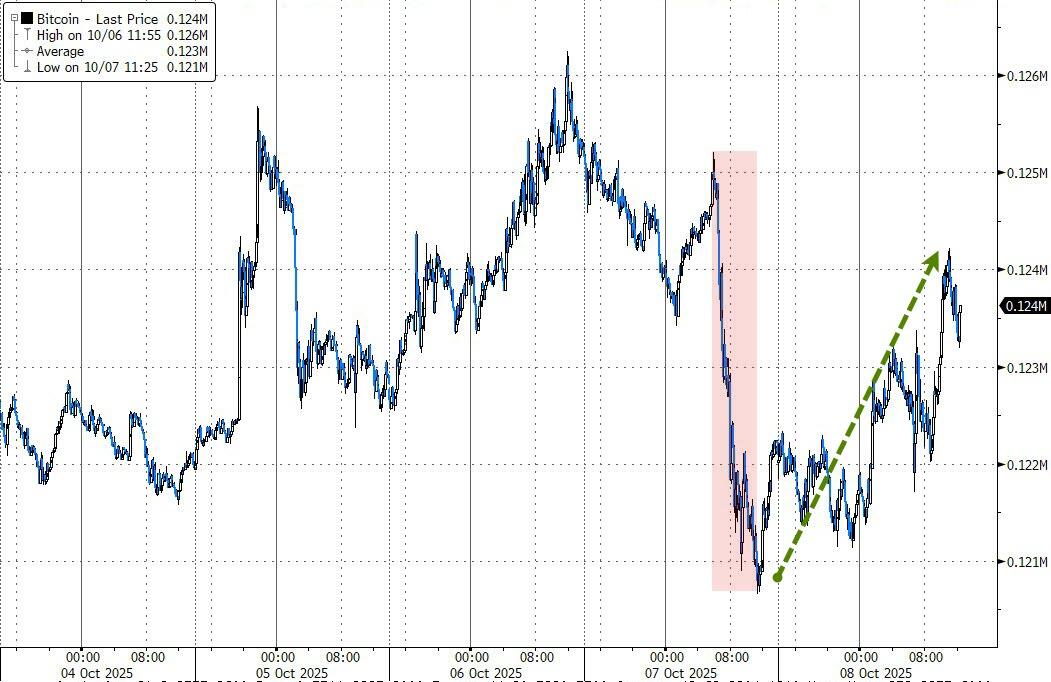
Bitcoin, meanwhile, didn’t act as a haven and slipped for the week.
With global trade nerves this raw, is this just the start of more volatility, or will the market find its footing soon?
ETF Data updated through Thursday, October 9, 2025
How to use this StatSheet:
Out of the 1,800+ ETFs out there, I only pick the ones that trade over $5 million per day (HV ETFs), so you don’t get stuck with a lemon that nobody wants to buy or sell.
Trend Tracking Indexes (TTIs)
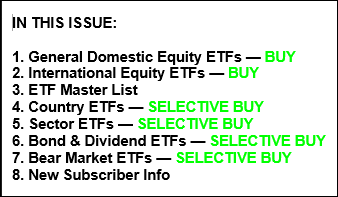
These are the main indicators that tell you when to buy or sell Domestic and International ETFs (section 1 and 2). They do that by comparing their position to their long-term M/A (Moving Average). If they cross above, and stay there, it’s a green light to buy. If they fall below, and keep going, it’s a red light to sell. And to make sure you don’t lose your shirt if things go south, I also use a 12% trailing stop loss on all positions in these categories.
All other investment areas don’t have a TTI and should be traded based on the position of each ETF relative to its own trend line (%M/A). That’s why I call them “Selective Buy.” In other words, if an ETF goes above its own trend line, you can buy it. But don’t forget to use a trailing sell stop of 12%, or less if you’re feeling nervous.
If some of these words sound like Greek to you, please check out the Glossary of Terms and new subscriber information in section 9.
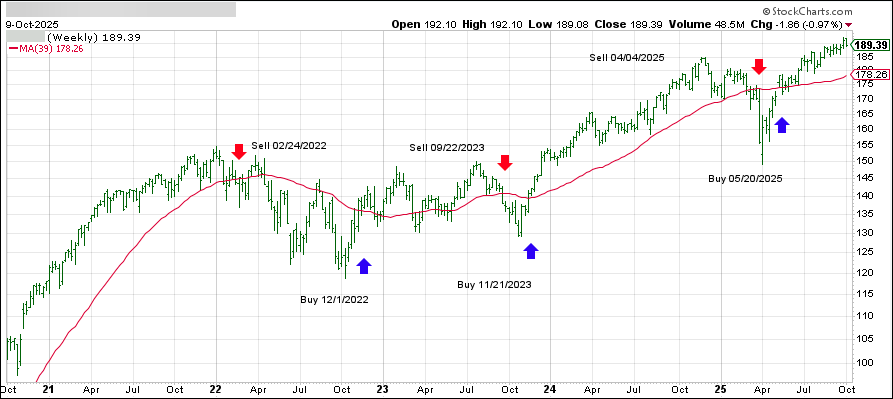
DOMESTIC EQUITY ETFs: BUY— effective 5/20/2025
Click on chart to enlarge
This is our main compass, the Domestic Trend Tracking Index (TTI-green line in the above chart). It has broken above its long-term trend line (red) by +6.52% and remains in “Buy” mode, with our new holdings being subject to our trailing sell stops.
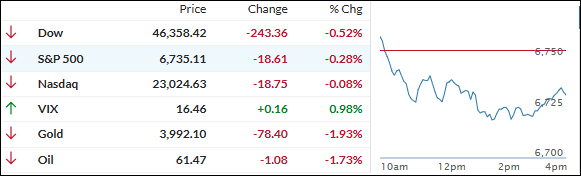
The markets got off to a hot start, with the S&P 500 and Nasdaq hitting fresh all-time intraday highs early on, but things fizzled as the session wore on and all three major indexes slipped into the red by the close—though some late dip buying helped trim those midday losses.
On the bright side, Costco’s stock popped 2% after it delivered another round of strong September sales, and Delta Air Lines soared 6% on upbeat earnings and an improved outlook.
Despite yesterday’s eight-out-of-nine winning streak for the S&P 500 and the Nasdaq’s historic jump over 23,000, today was a different story.
With no big economic reports thanks to the government shutdown, all eyes were on the Fed, as traders listened in on Chair Powell and other officials for hints about the next move following Wednesday’s split Fed minutes.
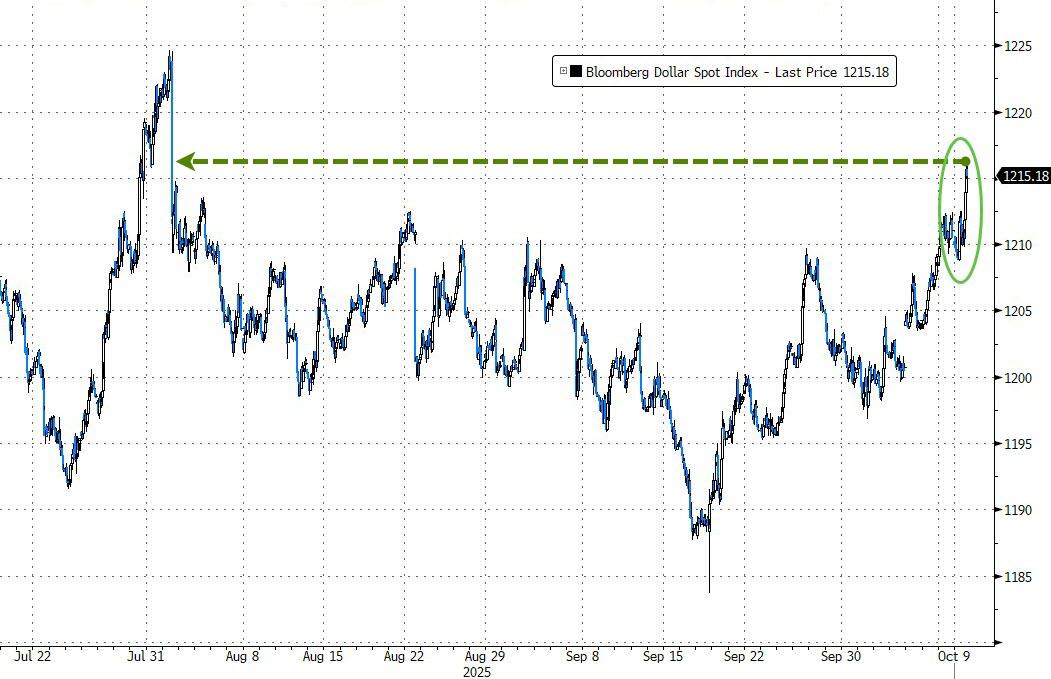
Nearly everything moved lower, except the dollar—which rallied to a two-month high and dragged down gold and silver, both of which lost their grip on record territory after early surges.
Even the “Mag 7” tech giants only managed to claw back to unchanged after a rough patch.
Bitcoin wandered lower while bond yields ticked up. Are today’s broad losses just a bump in the road, or is more volatility about to hit?
Stocks started off strong Wednesday, bouncing back after Oracle’s stumble yesterday snapped the S&P 500’s seven-day winning streak and sparked fresh questions about how long the artificial intelligence boom can last.
Nvidia shares climbed 2% after CEO Jensen Huang said computing demand has jumped sharply—especially over the past six months—helping overshadow Oracle’s warning about thin margins in its cloud business and some tough deals renting out Nvidia chips.
The government shutdown rolled into its eighth day, with the Senate readying for yet another vote to reopen things after lawmakers once again failed to pass a new funding bill earlier in the week.
Traders are also keenly eyeing today’s Federal Reserve minutes for clues about what’s next, after a heated September meeting left people guessing about Fed policy.
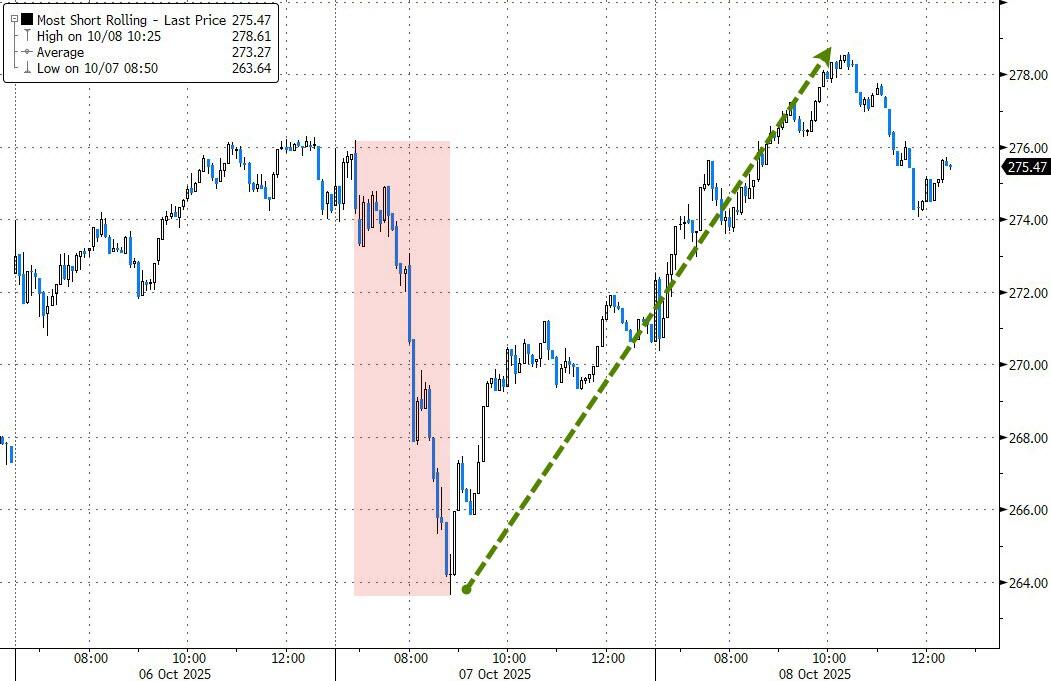
At the close, the Dow was unchanged, but the S&P 500 and Nasdaq made up lost ground and ended at new record highs—helped along by continued short-squeeze action.
Interestingly, the S&P’s “Mag 7” tech giants lagged the rest of the index today.
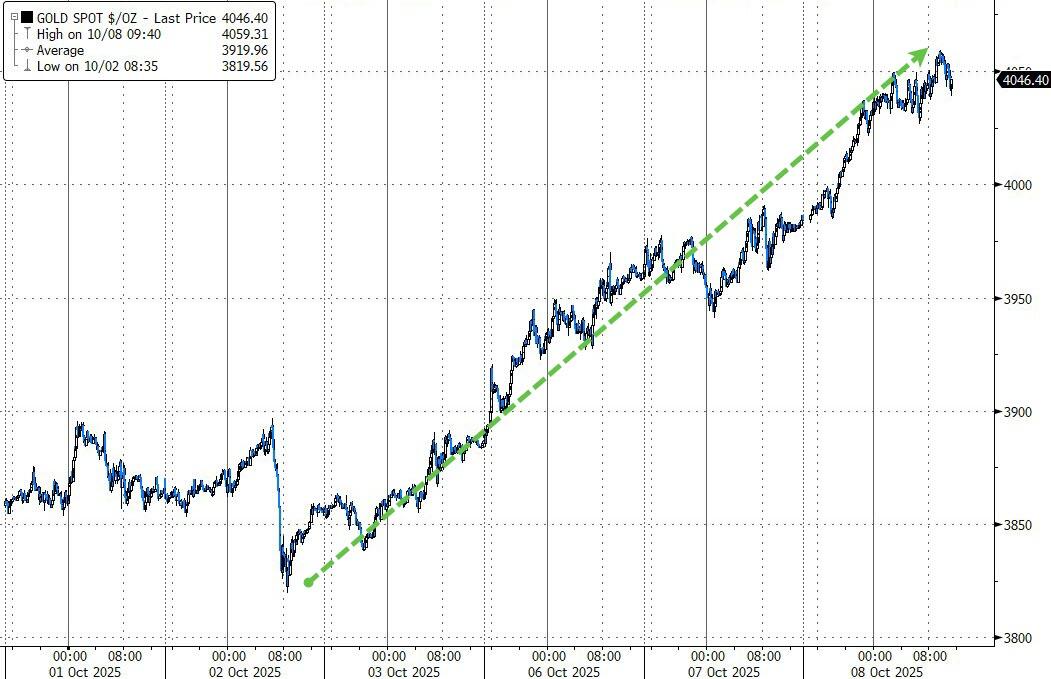
Gold added some drama, blasting through $4,000 to notch a record and logging a year-to-date gain of more than 55%—its best run in over 50 years and blowing away the S&P 500’s 15% climb.
Meanwhile, bond yields were mixed, bitcoin rebounded toward $124,000, and silver rallied 2.7% to edge closer to the $50 milestone.
With gold and bitcoin already breaking records, could silver be next to steal the spotlight?
Stocks kicked off with a little bounce, but that fizzled fast as Wall Street waited for fresh news out of Washington about the government shutdown, now dragging into its second week.
Hopes for a quick restart were dashed after the Senate shot down the House’s funding bill for the fifth time, mostly sticking with party lines—and keeping the government closed through next week.
With so much uncertainty around the shutdown, investors started sidestepping riskier bets and crowding into safe havens, sending gold futures soaring to $4,000 an ounce for the first time ever.
The ongoing shutdown means key economic reports like September’s jobs data are still stuck on the shelf, leaving the Fed with less to work with for its next rate decision—a tough spot when everyone’s already on edge about jobs and inflation.
As traders look for something to help shape their outlook, attention is turning to Wednesday’s Fed minutes and what top Fed officials might say this week.
Excitement about possible Fed rate cuts and fresh M&A talk helped push the S&P 500 and Nasdaq higher Monday, but that didn’t last.
Oracle’s warning about razor-thin margins for its AI chip business knocked stocks off their perch by the close, snapping the S&P’s seven-day winning streak.
Bond yields slid and the dollar clawed back some ground. Meanwhile, bitcoin retreated from yesterday’s record high above $126,000, landing near $121,000 to finish the day.
With this mix of headlines, is Wall Street in for more swings as the shutdown drags on, or will traders catch a break soon?