Weekly StatSheet For The ETF Tracker Newsletter – Updated Through 02/02/2017

Ulli ETF StatSheet Contact

ETF Data updated through Thursday, February 2, 2017

Methodology/Use of this StatSheet:

  1. From the universe of over 1,800 ETFs, I have selected only those with a trading volume of over $5 million per day (HV ETFs), so that liquidity and a small bid/ask spread are assured.
  2. Trend Tracking Indexes (TTIs)

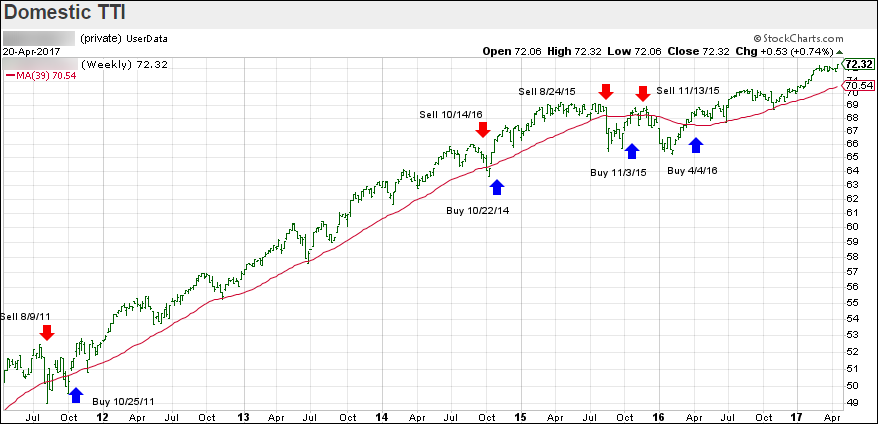
Buy or Sell decisions for Domestic and International ETFs (section 1 and 2), are made based on the respective TTI and its position either above or below its long-term M/A (Moving Average). A crossing of the trend line from below accompanied by some staying power above constitutes a “Buy” signal. Conversely, a clear break below the line constitutes a “Sell” signal. Additionally, I use a 7.5% trailing stop loss on all positions in these categories to control downside risk.

  1. All other investment arenas do not have a TTI and should be traded based on the position of the individual ETF relative to its own respective trend line (%M/A). That’s why those signals are referred to as a “Selective Buy.” In other words, if an ETF crosses its own trendline to the upside, a “Buy” signal is generated. Since these areas tend to be more volatile, I recommend a wider trailing sell stop of 7.5% -10% depending on your risk tolerance.

If you are unfamiliar with some of the terminology, please see Glossary of Terms and new subscriber information in section 9.


  1. DOMESTIC EQUITY ETFs: BUY — since 4/4/2016

Click on chart to enlarge

Our main directional indicator, the Domestic Trend Tracking Index (TTI-green line in the above chart) is positioned above its long-term trend line (red) by +1.84% after having generated a new Domestic Buy signal effective 4/4/2016 as posted.

Read More

Riding The Range

Ulli Market Commentary Contact

[Chart courtesy of MarketWatch.com]
  1. Moving the Markets

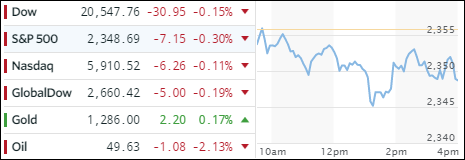
“Dead man walking” would best describe today’s session as the major indexes continued their recent sideways pattern by vacillating above and below their respective trend lines with nothing to show for at the end. It’s been now 78 days since the S&P 500 moved 1%, which simply tells us how narrow this trading channel has been.

Bonds went nowhere with the 1-year Treasury yield barely budging and even the always lurking and potentially trend affecting VIX was flat. Oil dropped a slight -0.35%, but the winner was gold, which gained 0.79%.

On deck is tomorrow’s jobs report, which could move the markets in either direction, although I think it will take a back seat to the latest announcements from the White House in regards to the potential protectionist and populist sentiment.

Read More

Apple Spikes Nasdaq; Other Indexes Flat

Ulli Market Commentary Contact

[Chart courtesy of MarketWatch.com]
  1. Moving the Markets

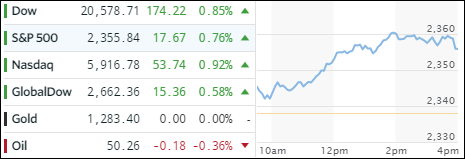
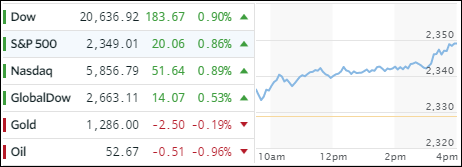
An early rally fizzled in a hurry as the Dow and S&P 500 dipped into negative territory but managed to crawl back to  barely conquer the unchanged line. The Nasdaq ended solidly in the green by +0.50% thanks to gains in Apple shares, which rallied 6.1% to $128.75 and reached its highest close in 18 months.

The Fed was up next and while they did not change interest rates, as expected, their accompanying language lacked detail as to when the next rate hike might be forthcoming. Remember, back in December 2016, it appeared that 3 hikes during 2017 seemed like a foregone conclusion.

Wall Street hates uncertainty, which was reflected in today’s session and which resembled predominantly aimless meandering as stocks struggled to find momentum. The dollar took a dive after the Fed’s decision but ended relatively unchanged while Treasury yields rose.

Chaos happened in the energy complex as computer algos got stuck in a tug-of-war with oil selling off, ramping up sharply thereafter, crashing again to the lows but rallying into the close on a weak dollar. Surely, with that much idiocy, traders in that complex have to be sporting a head of gray hairs.

Read More

Dow Clings To Gains For The Month

Ulli Market Commentary Contact

[Chart courtesy of MarketWatch.com]
  1. Moving the Markets

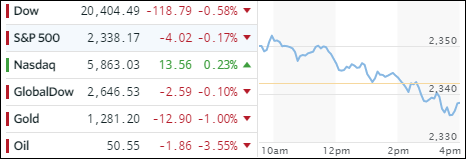
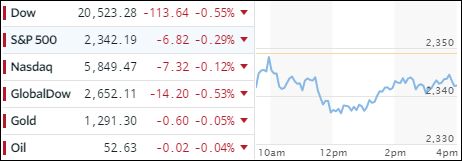
Early market momentum followed yesterday’s theme with the major indexes heading south and vacillating below their unchanged lines for most of the session. During the last hour, buyers stepped in, as the VIX was crushed, and managed to push the major indexes back towards their break-even points for the day with only the Nasdaq actually closing in the green.

The Dow managed to hang on to the positive side of the equation for the month and scored  its first positive January since 2013, while the last hour ramp saved the Small Caps from losing value for the 4th January in a row. On the other side, gold had its 4th successive positive January and its 8th in the last 11 years.

Here’s how Bloomberg’s Michael Regan summed it up:

It’s tempting to blame Trump’s latest statements for everything going on in the markets, but some big-name earnings make it obvious that equities would have struggled even if the President had taken today off. UPS showed the risk from the surging dollar last quarter and spoke of “continued softness in industrial production,” while Exxon Mobil’s $2 billion writedown shows that all the shoes from the oil bear market have yet to drop. Then there is Under Armour and Harley Davidson, which may not be sending any macro signals but are ugly stories regardless. About two-fifths of the way into the earnings season, the rate at which S&P 500 companies are beating estimates has slowed to 2.7% and the growth rate is 4%. A blockbuster earnings season may have helped the market look past the volatility in the White House, but at the moment it’s not providing enough of a distraction.

Read More

Wall Street Slips As The Trump Pump Turns Into The Trump Slump

Ulli Market Commentary Contact

[Chart courtesy of MarketWatch.com]
  1. Moving the Markets

I had to happen eventually. After a tremendous amount of hype and hope since Election Day, some sense of reality had to set in. It did today as investors worried that not all of the new President’s ideas and policies may be market friendly. Such was the case with the curb on immigration ordered by Trump, which caused protests and rallies over the weekend leading up to a sharp sell-off in the futures markets.

While equities dropped the most this year, it seems to me that traders and investors are of the mindset that records highs in the major indexes are now supposed to be a regular occurrence, which clearly points to Wall Street’s delusional sense of reality. Sure, Trump’s pro-growth proposals may be positive to economic activity but his ideas dealing with protectionism may not.

Clearly, the markets have been put on notice that complacency is no longer a valid state of mind. In the end, to us trend followers, none of the arguments matter, we’re only interested in the status of the long-term trend; and that remains bullish for the time being.

Read More

One Man’s Opinion: 2017’s Real Milestone (Or Why Interest Rates Can Never Go Back To Normal)

Ulli Market Review Contact

By John Rubino

Forget about NAFTA or OPEC or TPP or crowd size or hand size or any other acronym or stat or concept that obsesses the financial press these days. Only two numbers actually matter.

The first is $20 trillion, which is the level the US federal debt will exceed sometime around June of this year. Here’s the current total as measured by the US Debt Clock:

To put $20 trillion into perspective, it’s about $160,000 per US taxpayer, and exists in addition to the mortgage, credit card, auto, and student debt that our hypothetical taxpayer probably carries. It is in short, way too much for the average wage slave to manage without some kind of existential crisis.

It’s also way more than it used to be. During his tenure, president George W. Bush (2000 – 2008) nearly doubled the government’s debt, which is to say his administration borrowed as much as all its predecessors from Washington through Clinton combined. At the time this seemed like a never-to-be-duplicated feat of governmental profligacy. But the very next administration topped it, taking the federal debt from $10 trillion to the soon-to-be-achieved $20 trillion. And the incoming administration apparently sees no problem with continuing the pattern.

Read More