
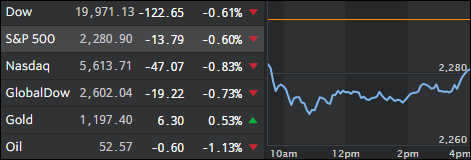
- Moving the Markets
I had to happen eventually. After a tremendous amount of hype and hope since Election Day, some sense of reality had to set in. It did today as investors worried that not all of the new President’s ideas and policies may be market friendly. Such was the case with the curb on immigration ordered by Trump, which caused protests and rallies over the weekend leading up to a sharp sell-off in the futures markets.
While equities dropped the most this year, it seems to me that traders and investors are of the mindset that records highs in the major indexes are now supposed to be a regular occurrence, which clearly points to Wall Street’s delusional sense of reality. Sure, Trump’s pro-growth proposals may be positive to economic activity but his ideas dealing with protectionism may not.
Clearly, the markets have been put on notice that complacency is no longer a valid state of mind. In the end, to us trend followers, none of the arguments matter, we’re only interested in the status of the long-term trend; and that remains bullish for the time being.
- ETFs in the Spotlight (updated for 2017)
In case you missed the announcement and description of this section, you can read it here again.
It features 10 broadly diversified and sector ETFs from my HighVolume list as posted every Saturday. Furthermore, they are screened for the lowest MaxDD% number meaning they have been showing better resistance to temporary sell offs than all others over the past year.
The below table simply demonstrates the magnitude with which some of the ETFs are fluctuating in regards to their positions above or below their respective individual trend lines (%M/A). A break below, represented by a negative number, shows weakness, while a break above, represented by a positive percentage, shows strength.
For hundreds of ETF choices, be sure to reference Thursday’s StatSheet.
Year to date, here’s how the 2017 candidates have fared so far:
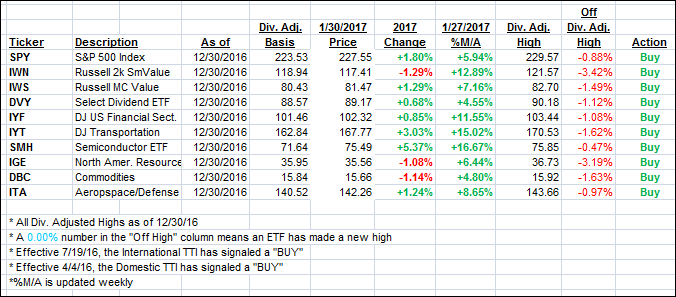
Again, the %M/A column above shows the position of the various ETFs in relation to their respective long term trend lines, while the trailing sell stops are being tracked in the “Off High” column. The “Action” column will signal a “Sell” once the -7.5% point has been taken out in the “Off High” column.
- Trend Tracking Indexes (TTIs)
Our Trend Tracking Indexes (TTIs) headed south with the major indexes hovering below their respective unchanged lines all day.
Here’s how we closed 1/30/2017:
Domestic TTI: +1.72% (last close +1.97%)—Buy signal effective 4/4/2016
International TTI: +4.44% (last close +5.18%)—Buy signal effective 7/19/2016
Disclosure: I am obliged to inform you that I, as well as my advisory clients, own some of the ETFs listed in the above table. Furthermore, they do not represent a specific investment recommendation for you, they merely show which ETFs from the universe I track are falling within the guidelines specified.
Contact Ulli