ETFs On The Cutline – Updated Through 01/27/2017

Ulli Market Commentary Contact

Below please find the latest High Volume ETFs Cutline report, which shows how far above or below their respective long-term trend lines (39 week SMA) my currently tracked ETFs are positioned.

This report covers the HV ETF Master List from Thursday’s StatSheet and includes 366 High Volume ETFs ETFs, defined as those with an average daily volume of more than $5 million, of which currently 217 (last week 228) are hovering in bullish territory. The yellow line separates those ETFs that are positioned above their trend line (%M/A) from those that have dropped below it.

Take a look:

The HV ETF Master Cutline Report            

In case you are not familiar with some of the terminology used in the reports, please read the Glossary of Terms.

If you missed the original post about the Cutline approach, you can read it here.

ETF Tracker Newsletter For January 27, 2017

Ulli Market Commentary Contact

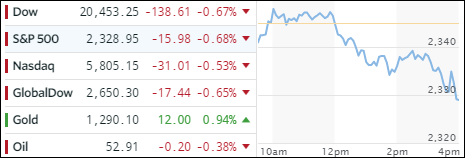
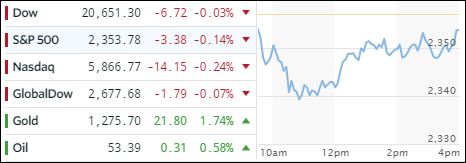
[Chart courtesy of MarketWatch.com]
  1. Moving the Markets

Keeping the major indexes in check was a report showing that US economic growth slowed in the 4th quarter expanding 1.6% for all of 2016, its worst performance since 2011. Sure, there were periods of stronger growth, such as in the third quarter, which clocked in at a 3.5% annual rate but, in the end, 2016 turned out to anemic. We now have to see if Trump’s campaign promise of delivering a solid 4% based on cutting taxes, reducing regulation and increasing infrastructure spending will actually come to fruition.

Here’s Deutsche Bank with some more details:

It appears that Deutsche Bank’s warning that the global economy is about to roll over was spot on, because moments ago the Bureau of Economic Analysis reported that GDP in Q4 rose only 1.9%, barely above the lowest forecast of 1.7%, and below both the consensus estimate of 2.2% and the whisper estimate of 2.5%-2.6%. The reason for the big miss, and nearly 50% drop from the 3.5% print in Q3: a collapse in contribution to GDP from trade (net exports and imports) which subtracted a whopping 1.7% from the headline number. So much for that soybean bumper boost to the US economy. The silver lining: Business investment picked up to 0.67% of the final print, potentially a harbinger for faster capital spending in 2017.

Then, BofA chimed in as to what has driven some of that rally in “Largest US Equity Outflows In 4 Months:”

While the S&P500 market may remain pinned just why of all time highs, this appears to be from ongoing short covering, and is not – at least in the latest week – the result of new money entering the market. Quite the opposite: according to the latest BofA fund flow analysis based on EPFR data, in the latest week, US equities saw $6.3 billion in outflows, the largest weekly redemption from US mutual funds and ETFs in four months, since before the presidential election. And as investors pulled cash out of US stocks, they quickly reallocated it back into bonds, with all major classes seeing inflows, with notable mentions for government bonds, which had the biggest inflows since July 2016, and TIPS, where the demand for inflation protection is now the highest since the great China reflation scare of 2011 (it proved quite transitory).

For the week, the major indexes gained and hit record highs while bonds ended barely unchanged. The US dollar fell for the 5th week in a row and closed at 2-month lows. Silver spiked back to even while gold was slammed back below the $1,200 level.

Read More

Weekly StatSheet For The ETF Tracker Newsletter – Updated Through 01/26/2017

Ulli ETF StatSheet Contact

ETF Data updated through Thursday, January 26, 2017

Methodology/Use of this StatSheet:

  1. From the universe of over 1,800 ETFs, I have selected only those with a trading volume of over $5 million per day (HV ETFs), so that liquidity and a small bid/ask spread are assured.
  2. Trend Tracking Indexes (TTIs)

Buy or Sell decisions for Domestic and International ETFs (section 1 and 2), are made based on the respective TTI and its position either above or below its long-term M/A (Moving Average). A crossing of the trend line from below accompanied by some staying power above constitutes a “Buy” signal. Conversely, a clear break below the line constitutes a “Sell” signal. Additionally, I use a 7.5% trailing stop loss on all positions in these categories to control downside risk.

  1. All other investment arenas do not have a TTI and should be traded based on the position of the individual ETF relative to its own respective trend line (%M/A). That’s why those signals are referred to as a “Selective Buy.” In other words, if an ETF crosses its own trendline to the upside, a “Buy” signal is generated. Since these areas tend to be more volatile, I recommend a wider trailing sell stop of 7.5% -10% depending on your risk tolerance.

If you are unfamiliar with some of the terminology, please see Glossary of Terms and new subscriber information in section 9.


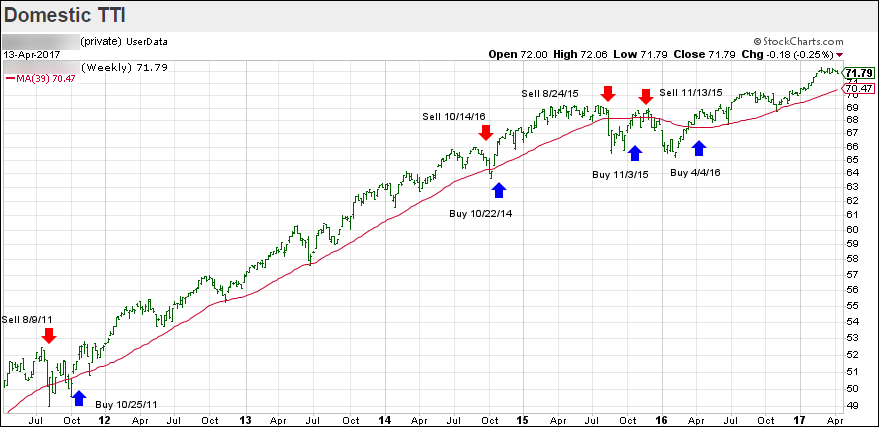
  1. DOMESTIC EQUITY ETFs: BUY — since 4/4/2016

Click on chart to enlarge

Our main directional indicator, the Domestic Trend Tracking Index (TTI-green line in the above chart) is positioned above its long-term trend line (red) by +2.07% after having generated a new Domestic Buy signal effective 4/4/2016 as posted.

Read More

Equities Mixed; S&P 500 Touches 2,300

Ulli Market Commentary Contact

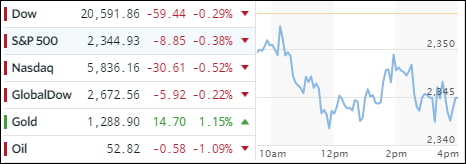
[Chart courtesy of MarketWatch.com]
  1. Moving the Markets

It was pretty much a day of consolidation after the Dow pierced the 20k milestone yesterday, however, the S&P 500 managed to touch the 2,300 level but backed off and closed 3 points below it.

Weighing on the S&P and Nasdaq was Qualcomm, which gave back 5% after a lower-than-expected rise in quarterly revenue. Still, the Dow managed to hold on to its 20k level and added 0.16% for the day.

Besides Trump’s business friendly decisions, earnings were center stage, have boosted sentiment and are expected to show a growth of 7%, which would make it the biggest increase in a couple of years. So far, 146 companies have reported earnings through this morning. 69.2% have topped expectations compared to an average of 63.6% over the last 23 years.

As I have posted repeatedly, reality and the stock market are two different and entirely separate things. Take a look at this chart, courtesy of ZH:

Read More

Dow Slices Through The 20,000 Milestone Marker

Ulli Market Commentary Contact

[Chart courtesy of MarketWatch.com]
  1. Moving the Markets

It seemed like forever, but it’s been only 28 days of treading water before upward momentum was sufficient enough to conquer the 20k milestone. Looking back to the 800 plus point drop in the Dow during election night, which appeared to signal a return to bear market territory, it’s been a truly remarkable recovery off the lows resulting in a 10% gain.

Keep in mind, however, that the Dow only represents 30 companies, of which only 6 stocks, namely GS, BA, IBM, UNH, HD and JPM, were responsible for 50% of the gains. Just as noteworthy is the fact that GS alone accounted for 21% of the Dow’s increase.

Interest rates rose with the 10-year Treasury yield now settling at 2.53%. Recall that several top bond managers forecast a negative effect on equities should the yield settle within the 2.6% to 3% area. As yields rose today, bonds got clobbered with the widely held TLT giving back -1.26% for the day.

The dollar weakened again, which should have been positive for gold but wasn’t today, as the yellow metal lost -0.90%. President Trump, along with others, has called the dollar overvalued and, as if on command, it’s been sliding all year. Here is the updated chart along with the divergence to the S&P 500:

Read More

Earnings Push S&P 500 And Nasdaq To New Highs

Ulli Market Commentary Contact

[Chart courtesy of MarketWatch.com]
  1. Moving the Markets

Today it was a battle between earnings and uncertainty over Trump’s pro-business agenda. At least for today, earnings won the battle, and the major indexes rode the positive momentum higher. The materials and financial sectors fared the best climbing 2.5% and 1.2% respectively.

With earnings season heating up, so far S&P profits are supposed to have risen some 6.7% in the last quarter which, if true, would make it the strongest growth in a couple of years. However, valuation-wise, we have moved towards lofty levels with the post-election rally, which was based on nothing but hope and promises. Given that, the S&P 500 is trading at about 17 times forward 12-month earnings, which is far above the 10-year median of 14.2.

Then again, none of that matters, it’s up, up and away until one day you’ll hear this giant sucking sound when the air comes out of the bubble; it’s not a matter of “if” but “when.” In the meantime, we’ll stay the course and follow the major trend higher until it ends.

Read More