
- Moving the Markets
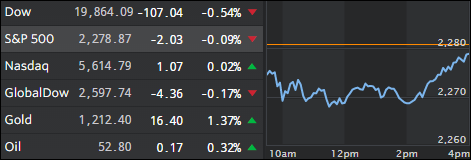
Early market momentum followed yesterday’s theme with the major indexes heading south and vacillating below their unchanged lines for most of the session. During the last hour, buyers stepped in, as the VIX was crushed, and managed to push the major indexes back towards their break-even points for the day with only the Nasdaq actually closing in the green.
The Dow managed to hang on to the positive side of the equation for the month and scored its first positive January since 2013, while the last hour ramp saved the Small Caps from losing value for the 4th January in a row. On the other side, gold had its 4th successive positive January and its 8th in the last 11 years.
Here’s how Bloomberg’s Michael Regan summed it up:
It’s tempting to blame Trump’s latest statements for everything going on in the markets, but some big-name earnings make it obvious that equities would have struggled even if the President had taken today off. UPS showed the risk from the surging dollar last quarter and spoke of “continued softness in industrial production,” while Exxon Mobil’s $2 billion writedown shows that all the shoes from the oil bear market have yet to drop. Then there is Under Armour and Harley Davidson, which may not be sending any macro signals but are ugly stories regardless. About two-fifths of the way into the earnings season, the rate at which S&P 500 companies are beating estimates has slowed to 2.7% and the growth rate is 4%. A blockbuster earnings season may have helped the market look past the volatility in the White House, but at the moment it’s not providing enough of a distraction.
- ETFs in the Spotlight (updated for 2017)
In case you missed the announcement and description of this section, you can read it here again.
It features 10 broadly diversified and sector ETFs from my HighVolume list as posted every Saturday. Furthermore, they are screened for the lowest MaxDD% number meaning they have been showing better resistance to temporary sell offs than all others over the past year.
The below table simply demonstrates the magnitude with which some of the ETFs are fluctuating in regards to their positions above or below their respective individual trend lines (%M/A). A break below, represented by a negative number, shows weakness, while a break above, represented by a positive percentage, shows strength.
For hundreds of ETF choices, be sure to reference Thursday’s StatSheet.
Year to date, here’s how the 2017 candidates have fared so far:
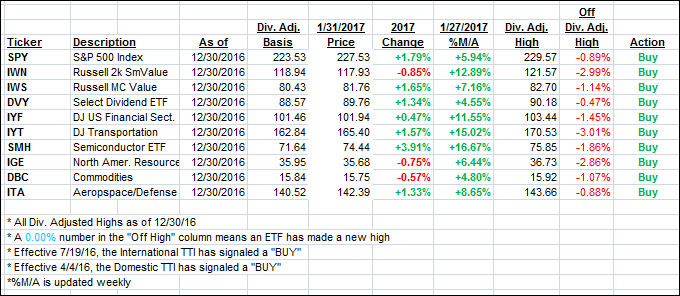
Again, the %M/A column above shows the position of the various ETFs in relation to their respective long term trend lines, while the trailing sell stops are being tracked in the “Off High” column. The “Action” column will signal a “Sell” once the -7.5% point has been taken out in the “Off High” column.
- Trend Tracking Indexes (TTIs)
Our Trend Tracking Indexes (TTIs) edged higher by a fraction of a percent as market direction was predominantly sideways.
Here’s how we closed 1/31/2017:
Domestic TTI: +1.78% (last close +1.72%)—Buy signal effective 4/4/2016
International TTI: +4.53% (last close +4.44%)—Buy signal effective 7/19/2016
Disclosure: I am obliged to inform you that I, as well as my advisory clients, own some of the ETFs listed in the above table. Furthermore, they do not represent a specific investment recommendation for you, they merely show which ETFs from the universe I track are falling within the guidelines specified.
Contact Ulli