
- Moving the Markets
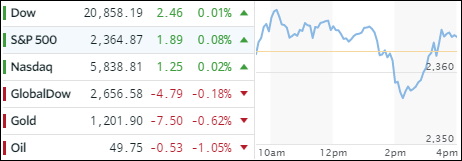
Another directionless day with the major indexes hovering below the unchanged line but a last minute ramp helped to get us into the green thereby avoiding a 6th straight loss for the Dow.
The indexes are now unchanged from Trump’s rally speech. Financial conditions remain tight with bonds having another ugly day as yields have now risen for 9 straight days. As ZH reports, the 10-year T-bond has not had a longer losing streak since 1974.
High yield credit too was negatively affected as well with the widely followed HYG ETF losing at the tune of -2.3% in March alone and breaking below its 50-day moving average.
There was not much strength anywhere as commodities headed south joined by precious metals and oil, which lost again after yesterday’s -5% drubbing.
The question in my mind is when will stocks notice? Especially in view of the fact that Macro data is deteriorating almost daily and GDP growth is also going the wrong way.
- ETFs in the Spotlight (updated for 2017)
In case you missed the announcement and description of this section, you can read it here again.
It features 10 broadly diversified and sector ETFs from my HighVolume list as posted every Saturday. Furthermore, they are screened for the lowest MaxDD% number meaning they have been showing better resistance to temporary sell offs than all others over the past year.
The below table simply demonstrates the magnitude with which some of the ETFs are fluctuating in regards to their positions above or below their respective individual trend lines (%M/A). A break below, represented by a negative number, shows weakness, while a break above, represented by a positive percentage, shows strength.
For hundreds of ETF choices, be sure to reference Thursday’s StatSheet.
Year to date, here’s how the 2017 candidates have fared so far:
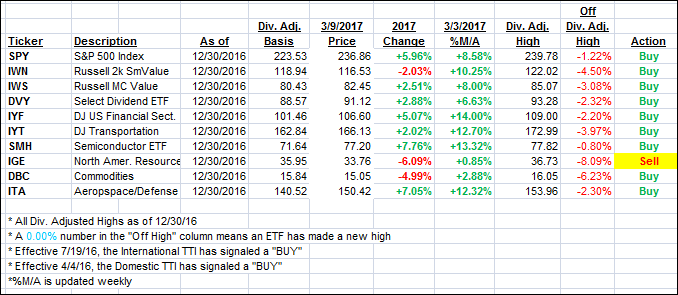
Again, the %M/A column above shows the position of the various ETFs in relation to their respective long term trend lines, while the trailing sell stops are being tracked in the “Off High” column. The “Action” column will signal a “Sell” once the -7.5% point has been taken out in the “Off High” column.
- Trend Tracking Indexes (TTIs)
Our Trend Tracking Indexes (TTIs) were mixed as the trend remained uncertain.
Here’s how we closed 3/9/2017:
Domestic TTI: +2.51% (last close +2.52%)—Buy signal effective 4/4/2016
International TTI: +5.04% (last close +4.89%)—Buy signal effective 7/19/2016
Disclosure: I am obliged to inform you that I, as well as my advisory clients, own some of the ETFs listed in the above table. Furthermore, they do not represent a specific investment recommendation for you, they merely show which ETFs from the universe I track are falling within the guidelines specified.
Contact Ulli