Dollar Slumps, Gold Pumps And Equities Dump

Ulli Market Commentary Contact

[Chart courtesy of MarketWatch.com]
  1. Moving the Markets

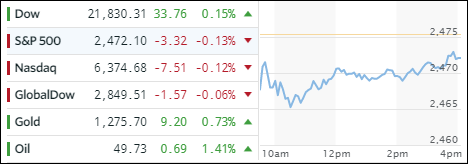
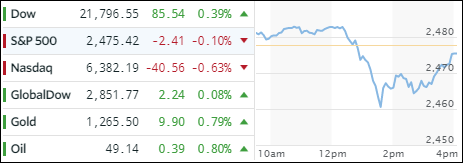
I finished yesterday’s piece by stating that the current VIX level is simply unsustainable. As if by magic, the VIX suddenly exploded to the upside today spiking from 11 to 17, which is the most in 8 months and interrupting the longest period of calm for the S&P 500 since 1969.

Consequently, the major indexes took a long overdue dive with the Nasdaq suffering the biggest daily drop in almost 12 months as turmoil in Washington put a big question mark on the feasibility of Trump’s pro-growth agenda, which had been the basis for the post-election equity drive into record territory.

Political uncertainty was the culprit, and it played out as follows:

  1. S&P 500 biggest drop since Sept 2016 (broke below 50-dma)
  2. Small Caps biggest drop since Brexit June 2016 (broke below 50-, 100-dma)
  3. Nasdaq biggest drop since Brexit June 2016
  4. Dow Industrials biggest drop since Sept 2016 (broke below 50-dma)
  5. Dow Transports biggest drop since June 2016 (broke below 50-, 100-dma, and near 200-dma) – now negative year-to-date

And across asset-classes:

  1. VIX biggest jump since Brexit June 2016 (smashed through 50-, 100- and 200-dma) above 15
  2. 30Y US Treasury Fut biggest gain since June 2016
  3. USD Index down 6th day in a row to lowest since trump election
  4. USDJPY’s biggest drop since July 2016 (broke below 50- and 100-dma) to 110 handle

Source: ZeroHedge

Financials took a big hit and are back in the red YTD as banks got hammered. Even Apple couldn’t survive the selling onslaught and dropped 3.4%, its worst day since April last year.

The flight to safety was on as Treasury yields crashed and bonds rallied with the widely held TLT gaining +1.46%. The dollar index was clubbed again for the 6th day in a row and has now reached pre-election levels. Gold was the beneficiary and broke above key technical resistance points.

Will this downdraft continue? It’s too early to tell, but all major indexes closed at their lows for the day, which does not bode well for a positive opening tomorrow.

Read More

Dollar Slumps And Gold Jumps

Ulli Market Commentary Contact

[Chart courtesy of MarketWatch.com]
  1. Moving the Markets

It was a mixed news bag as the housing recovery showed signs of “un-recovering” with Housing Starts dropping 2.6% in April after getting hammered in March with a 6.6% reduction. Not to be outdone, Building Permits joined in by tumbling 2.5% MoM, way below expectations.

On the retail side, the apocalypse continued as clothing retailer Rue21 filed for bankruptcy last night. Restructuring and streamlining is on the agenda translating to about 400 store closings (out of 1,179). Rating agency Fitch expects a flood of future defaults and has now eleven retailers on its concern list. Well, as I reported before, we are well on our way to the forecast 8,000 plus store closings for 2017.

The US dollar has been slipping and sliding for 5 days in a row and has now erased all post-election gains. The question remains as to whether we will see another rebound after testing these lows for the 3rd time in the past 2 months, ever since Trump commented on the “too-strong dollar.” The beneficiary of this weakness has been gold, which has been rallying for 5 days in a row.

I keep talking about the low levels of the VIX (Volatility Index), which has market participants in a sleepy state of complacency as it supports the narrative that markets can only go one way—and that is up. The VIX set a new record by having closed 17 consecutive days in a row below 11, which has never happened before! That is unbelievable and certainly not sustainable.

Read More

Weak Global Economic Data = Markets Racing To New Highs

Ulli Market Commentary Contact

[Chart courtesy of MarketWatch.com]
  1. Moving the Markets

The S&P 500 finally managed to break through its 2,400 glass ceiling to new all-time highs while the Nasdaq joined the fun by closing in record territory as well. Supporting actors were Johnson & Johnson, along with Cisco, both of which rallied more than 2%.

Today’s gain came in the face of the biggest global cyber attack in history, which struck over 100 nations but left the US mainly unaffected. The attack was focused on the old Windows operating systems, like XP and Vista, which Microsoft has not been supporting in many years and which are lacking up to date security measures. To me, it’s hard to believe that some governments and corporations are still operating using outdated platforms from an era that did not have to deal with the type of sophisticated hacking/spying software available these days.

In regards to world economies, not only did Chinese data disappoint, Europe showed negative numbers as well and US data was dismal, all of which sent the global macro surprise index (shown below) to its lowest since November. Ah yes, in this new normal environment, these are perfect reasons for the markets to rally.

Take a look:

Read More

One Man’s Opinion: Warning: Risk Parity Funds Will Trigger Another 1987-Type Crash

Ulli Market Review Contact

By Graham Summers

If you’ve been reading us for some time, you’ve probably wondered why the market keeps rallying no matter what.

Time and again, stocks start to breakdown and then suddenly BOOM they erupt higher. CNBC and other financial media outlets then trot out various narratives to explain the action.

“Stocks went up because the data was strong and the economy is improving!”

“Stocks went up because the data was weak and the Fed will have to intervene!”

These narratives, while amusing, are complete fiction.

Stocks are rallying due to abject intervention.

That intervention is occurring when the Fed has one of its proxies (one of the TBTF banks) engage in obvious and clear manipulation.

Now, market manipulation is a normal facet of the world ever since the 1987 Crash forced Reagan to create the Plunge Protection Team.

Read More

ETFs On The Cutline – Updated Through 05/12/2017

Ulli ETFs on the Cutline Contact

Below please find the latest High Volume ETFs Cutline report, which shows how far above or below their respective long-term trend lines (39 week SMA) my currently tracked ETFs are positioned.

This report covers the HV ETF Master List from Thursday’s StatSheet and includes 366 High Volume ETFs ETFs, defined as those with an average daily volume of more than $5 million, of which currently 243 (last week 237) are hovering in bullish territory. The yellow line separates those ETFs that are positioned above their trend line (%M/A) from those that have dropped below it.

Take a look:

The HV ETF Master Cutline Report            

In case you are not familiar with some of the terminology used in the reports, please read the Glossary of Terms.

If you missed the original post about the Cutline approach, you can read it here.

ETF Tracker Newsletter For May 12, 2017

Ulli ETF Tracker Contact

ETF Tracker StatSheet

https://theetfbully.com/2017/05/weekly-statsheet-etf-tracker-newsletter-updated-05112017/

ECONOMIC DATA POINTS CONTINUE TO WEAKEN

[Chart courtesy of MarketWatch.com]
  1. Moving the Markets

The low volatility environment continued as the VIX extended its steak of closing below 11 for 15 consecutive days thereby smashing the previous record. As a result, the major indexes moved in a narrow range, mostly below the unchanged line, appearing to bounce off a glass ceiling all week long.

Equities, with the exception of the Nasdaq, ended in the red for the week with the S&P 500 losing 9 points or -0.33%, a move that is hardly worth mentioning. The retail massacre continued as retail sales missed across the board summarized as follows:

  1. Retail Sales up 0.4%, missing expectations of +0.6%, up from an upward revised 0.1%
  2. Retail sales up 4.5% Y/Y, down from 5.2% in April
  3. Retail sales less autos rose 0.3% in April, est. 0.5%, unchanged from last month’s revised 0.3%
  4. Retail sales ex-auto dealers, building materials and gasoline stations rose 0.2% in April
  5. Retail sales ‘control group’ rose 0.2% m/m in April

Source: ZH

Financials were the loser over the last 5 trading days, but tech performed well with the FAANGs (Facebook, Amazon, Apple, Netflix, Google) taking top billing and accounting for most of the gains. Translated, it means that these 5 stocks gained in market cap while the remaining stocks in the S&P 500 ended in the red. Ouch!

US Macro data has now collapsed for the 8th straight week and has decoupled from reality in similar fashion as it did in 2015. Take a look at these charts and see how that ended up:

Read More