
- Moving the Markets
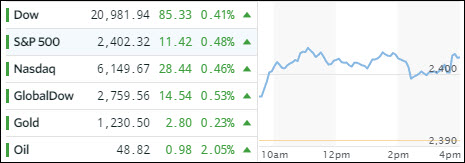
The S&P 500 finally managed to break through its 2,400 glass ceiling to new all-time highs while the Nasdaq joined the fun by closing in record territory as well. Supporting actors were Johnson & Johnson, along with Cisco, both of which rallied more than 2%.
Today’s gain came in the face of the biggest global cyber attack in history, which struck over 100 nations but left the US mainly unaffected. The attack was focused on the old Windows operating systems, like XP and Vista, which Microsoft has not been supporting in many years and which are lacking up to date security measures. To me, it’s hard to believe that some governments and corporations are still operating using outdated platforms from an era that did not have to deal with the type of sophisticated hacking/spying software available these days.
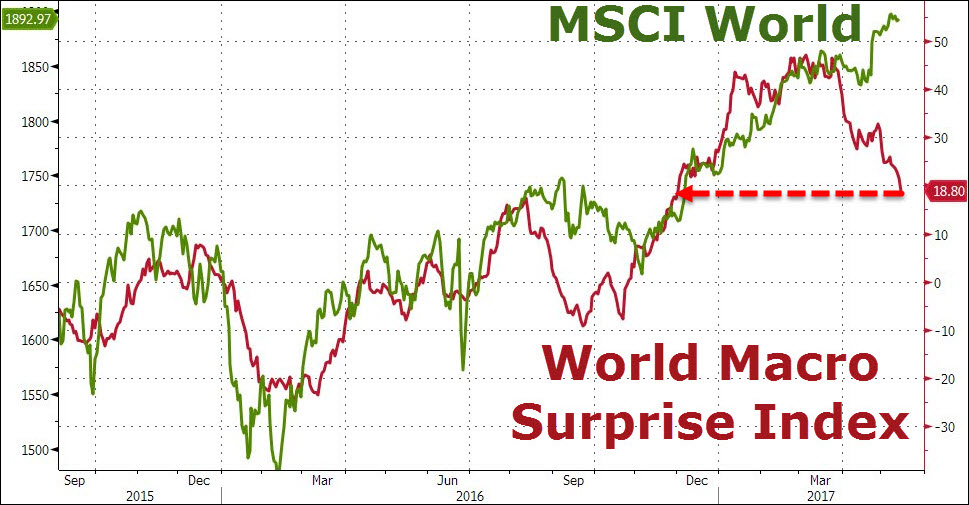
In regards to world economies, not only did Chinese data disappoint, Europe showed negative numbers as well and US data was dismal, all of which sent the global macro surprise index (shown below) to its lowest since November. Ah yes, in this new normal environment, these are perfect reasons for the markets to rally.
Take a look:
- ETFs in the Spotlight (updated for 2017)
In case you missed the announcement and description of this section, you can read it here again.
It features 10 broadly diversified and sector ETFs from my HighVolume list as posted every Saturday. Furthermore, they are screened for the lowest MaxDD% number meaning they have been showing better resistance to temporary sell offs than all others over the past year.
The below table simply demonstrates the magnitude with which some of the ETFs are fluctuating in regards to their positions above or below their respective individual trend lines (%M/A). A break below, represented by a negative number, shows weakness, while a break above, represented by a positive percentage, shows strength.
For hundreds of ETF choices, be sure to reference Thursday’s StatSheet.
Year to date, here’s how the 2017 candidates have fared so far:
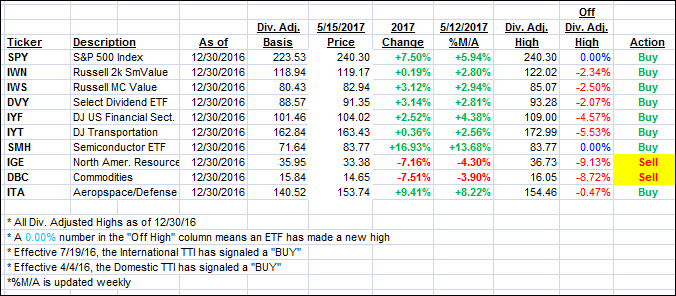
Again, the %M/A column above shows the position of the various ETFs in relation to their respective long term trend lines, while the trailing sell stops are being tracked in the “Off High” column. The “Action” column will signal a “Sell” once the -7.5% point has been taken out in the “Off High” column.
- Trend Tracking Indexes (TTIs)
Our Trend Tracking Indexes (TTIs) recovered as two of the three major indexes broke into record territory.
Here’s how we closed 5/15/2017:
Domestic TTI: +3.39% (last close +3.23%)—Buy signal effective 4/4/2016
International TTI: +8.20% (last close +7.76%)—Buy signal effective 7/19/2016
Disclosure: I am obliged to inform you that I, as well as my advisory clients, own some of the ETFs listed in the above table. Furthermore, they do not represent a specific investment recommendation for you, they merely show which ETFs from the universe I track are falling within the guidelines specified.
Contact Ulli