
- Moving the Markets
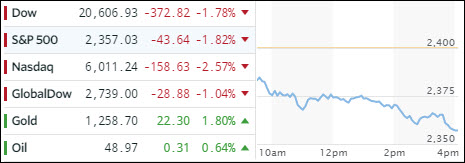
I finished yesterday’s piece by stating that the current VIX level is simply unsustainable. As if by magic, the VIX suddenly exploded to the upside today spiking from 11 to 17, which is the most in 8 months and interrupting the longest period of calm for the S&P 500 since 1969.
Consequently, the major indexes took a long overdue dive with the Nasdaq suffering the biggest daily drop in almost 12 months as turmoil in Washington put a big question mark on the feasibility of Trump’s pro-growth agenda, which had been the basis for the post-election equity drive into record territory.
Political uncertainty was the culprit, and it played out as follows:
- S&P 500 biggest drop since Sept 2016 (broke below 50-dma)
- Small Caps biggest drop since Brexit June 2016 (broke below 50-, 100-dma)
- Nasdaq biggest drop since Brexit June 2016
- Dow Industrials biggest drop since Sept 2016 (broke below 50-dma)
- Dow Transports biggest drop since June 2016 (broke below 50-, 100-dma, and near 200-dma) – now negative year-to-date
And across asset-classes:
- VIX biggest jump since Brexit June 2016 (smashed through 50-, 100- and 200-dma) above 15
- 30Y US Treasury Fut biggest gain since June 2016
- USD Index down 6th day in a row to lowest since trump election
- USDJPY’s biggest drop since July 2016 (broke below 50- and 100-dma) to 110 handle
Source: ZeroHedge
Financials took a big hit and are back in the red YTD as banks got hammered. Even Apple couldn’t survive the selling onslaught and dropped 3.4%, its worst day since April last year.
The flight to safety was on as Treasury yields crashed and bonds rallied with the widely held TLT gaining +1.46%. The dollar index was clubbed again for the 6th day in a row and has now reached pre-election levels. Gold was the beneficiary and broke above key technical resistance points.
Will this downdraft continue? It’s too early to tell, but all major indexes closed at their lows for the day, which does not bode well for a positive opening tomorrow.
- ETFs in the Spotlight (updated for 2017)
In case you missed the announcement and description of this section, you can read it here again.
It features 10 broadly diversified and sector ETFs from my HighVolume list as posted every Saturday. Furthermore, they are screened for the lowest MaxDD% number meaning they have been showing better resistance to temporary sell offs than all others over the past year.
The below table simply demonstrates the magnitude with which some of the ETFs are fluctuating in regards to their positions above or below their respective individual trend lines (%M/A). A break below, represented by a negative number, shows weakness, while a break above, represented by a positive percentage, shows strength.
For hundreds of ETF choices, be sure to reference Thursday’s StatSheet.
Year to date, here’s how the 2017 candidates have fared so far:
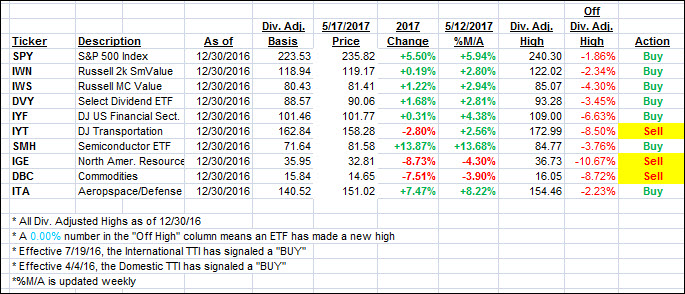
Again, the %M/A column above shows the position of the various ETFs in relation to their respective long term trend lines, while the trailing sell stops are being tracked in the “Off High” column. The “Action” column will signal a “Sell” once the -7.5% point has been taken out in the “Off High” column.
- Trend Tracking Indexes (TTIs)
Our Trend Tracking Indexes (TTIs) shifted in reverse as the first correction of the year finally materialized.
Here’s how we closed 5/17/2017:
Domestic TTI: +2.78% (last close +3.45%)—Buy signal effective 4/4/2016
International TTI: +7.49% (last close +8.64%)—Buy signal effective 7/19/2016
Disclosure: I am obliged to inform you that I, as well as my advisory clients, own some of the ETFs listed in the above table. Furthermore, they do not represent a specific investment recommendation for you, they merely show which ETFs from the universe I track are falling within the guidelines specified.
Contact Ulli