Stocks And Precious Metals Jump; Dollar Slips

Ulli Market Commentary Contact

[Chart courtesy of MarketWatch.com]
  1. Moving the Markets

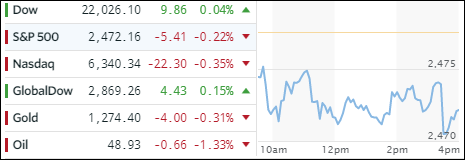
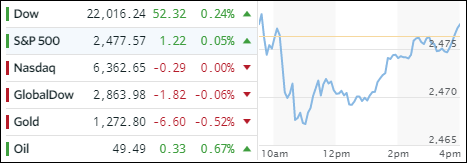
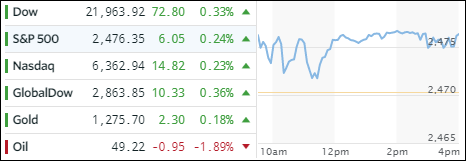
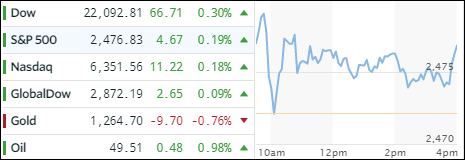
Another effort to push equities back to levels reached prior to last Wednesday’s sell-off was successful with all three major indexes gaining for the third day in a row as the S&P 500 is now lurking within 8 points of its all-time high and is back in the green for May. However, the fly in the ointment over the past few days has been low volume, which indicates lack of participation in this rally.

President Trump’s trip to Saudi Arabia proved to be beneficial for defense stocks as he signed a mammoth weapons deal, which lifted ITA +1.12% for the day. Interest rates climbed slightly with the 10-year yield reaching 2.25%. The US dollar continued its freefall with UUP losing another -0.16% reaching a level last seen in October 2016. Apparently Trump’s tough talk of “the dollar is too strong” seems to be working.

Precious metals gained on the day and following through from last week’s rally. Crude oil joined the party and recaptured the $50/barrel level but just stayed below $51. Of course, oil has been on a wild roller coaster ride this year ranging from a high of $55.03 to a low of $43.76 thanks to endless OPEC jawboning about production cutbacks, which have been making the headlines almost daily.

Read More

One Man’s Opinion: 1999 Called, They Want Their Stock Bubble Back…

Ulli Market Review Contact

By Simon Black

File this one away under “Completely Obvious…”

Last night the parent company of Snapchat reported a quarterly loss of more than TWO BILLION dollars.

Snapchat, of course, is the photo-focused social networking app that’s adored by tweens and adults who still live with their parents.

(Talk about a lucractive demographic.)

The company IPO’d just a few months ago with a market capitalization of $30+ billion despite slowing growth and a history of never turning a profit EVER.

According to the company’s quarterly report its finances have gone from bad to worse.

Operating cashflow dropped from negative $92.5 million to negative $155 million; and its total loss for the quarter including stock-based compensation was $2.2 billion.

It’s incredible that this is the same company that was a Wall Street favorite just eight weeks ago.

In fact on its first trading day back in March, Snap’s shares surged 44% as investors clamored to own a piece of this loss-making company whose shares confer absolutely zero voting rights.

After yesterday’s horrific results, Wall Street seems to have woken up, and the stock tanked nearly 25% in after-hours trading.

Read More

ETFs On The Cutline – Updated Through 05/19/2017

Ulli ETFs on the Cutline Contact

Below please find the latest High Volume ETFs Cutline report, which shows how far above or below their respective long-term trend lines (39 week SMA) my currently tracked ETFs are positioned.

This report covers the HV ETF Master List from Thursday’s StatSheet and includes 366 High Volume ETFs ETFs, defined as those with an average daily volume of more than $5 million, of which currently 264 (last week 243) are hovering in bullish territory. The yellow line separates those ETFs that are positioned above their trend line (%M/A) from those that have dropped below it.

Take a look:

The HV ETF Master Cutline Report            

In case you are not familiar with some of the terminology used in the reports, please read the Glossary of Terms.

If you missed the original post about the Cutline approach, you can read it here.
ETF Tracker Newsletter For May 19, 2017

Ulli ETF StatSheet Contact

ETF Tracker StatSheet

https://theetfbully.com/2017/05/weekly-statsheet-etf-tracker-newsletter-updated-05182017/

BULLARD PUMP DRIVES MARKETS

[Chart courtesy of MarketWatch.com]
  1. Moving the Markets

When all else fails, and the markets are in danger of heading south in a big way, it’s nice to know that we can always count on one of the Fed mouthpieces to create an enticing news headline, designed to be picked up by computer algos  to push the markets in the desired direction.

Such was the case today, when James Bullard took to the airwaves in a prepared speech saying that “all the talk of an “overheating” economy was just that saying that “financial market readings since the March decision have moved in the opposite direction” of what would normally occur after a rate hike, adding: “this may suggest that the FOMC’s contemplated policy rate path is overly aggressive relative to actual incoming data on U.S. macroeconomic performance.

Translation: We are not sure if further rate hikes are really warranted as he added that inflation and inflation expectations “have surprised to the downside” and noted that “financial market readings since the March decision have been opposite of expectations.”

That’s exactly what computer algos wanted to ‘hear’ and off to the races we went with the three major averages closing in the green for the day but in red for the week. US Macro data disappointed for the 9th straight week and have now dropped below the election lows as the chart shows:

Read More

Weekly StatSheet For The ETF Tracker Newsletter – Updated Through 05/18/2017

Ulli ETF StatSheet Contact

ETF Data updated through Thursday, May 18, 2017

Methodology/Use of this StatSheet:

  1. From the universe of over 1,800 ETFs, I have selected only those with a trading volume of over $5 million per day (HV ETFs), so that liquidity and a small bid/ask spread are assured.
  2. Trend Tracking Indexes (TTIs)

Buy or Sell decisions for Domestic and International ETFs (section 1 and 2), are made based on the respective TTI and its position either above or below its long-term M/A (Moving Average). A crossing of the trend line from below accompanied by some staying power above constitutes a “Buy” signal. Conversely, a clear break below the line constitutes a “Sell” signal. Additionally, I use a 7.5% trailing stop loss on all positions in these categories to control downside risk.

  1. All other investment arenas do not have a TTI and should be traded based on the position of the individual ETF relative to its own respective trend line (%M/A). That’s why those signals are referred to as a “Selective Buy.” In other words, if an ETF crosses its own trendline to the upside, a “Buy” signal is generated. Since these areas tend to be more volatile, I recommend a wider trailing sell stop of 7.5% -10% depending on your risk tolerance.

If you are unfamiliar with some of the terminology, please see Glossary of Terms and new subscriber information in section 9.


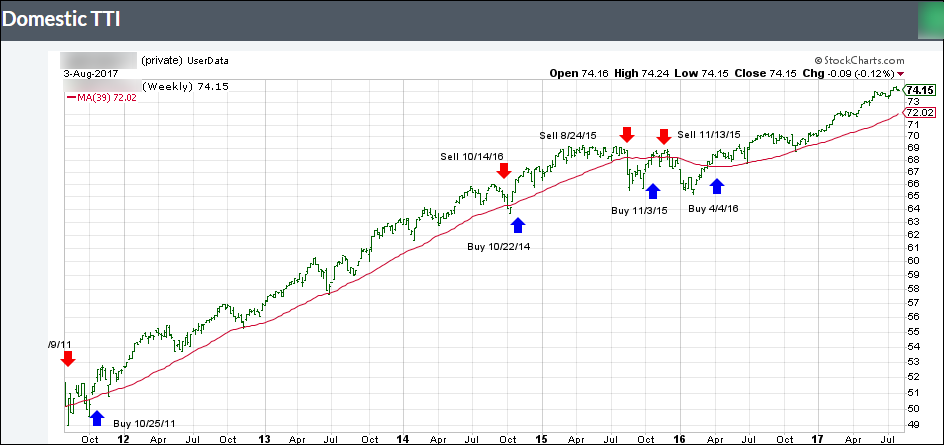
  1. DOMESTIC EQUITY ETFs: BUY — since 4/4/2016

Click on chart to enlarge

Our main directional indicator, the Domestic Trend Tracking Index (TTI-green line in the above chart) is positioned above its long-term trend line (red) by +2.97% after having generated a new Domestic Buy signal effective 4/4/2016 as posted.

Read More

Bouncing Off The Lows

Ulli Market Commentary Contact

[Chart courtesy of MarketWatch.com]
  1. Moving the Markets

Despite the major indexes closing at their lows of yesterday’s session, downside follow through was contained, and a rebound rally materialized but faded into the close. Nevertheless, equities managed to squeeze out some modest gains despite a bloodbath in the Brazilian stock market with EWZ getting spanked at the tune of -16.33%. Ouch!

Not only did domestic stocks bounce back but the US dollar also showed signs of life with UUP gaining a modest +0.36% after getting absolutely hammered 4 days in a row, however, the dollar index is still down 1% for the week. Both assets benefited from former FBI chief Comey’s admission under oath that “obstructions of his investigations never happened.” Imagine my surprise…

Uncertainty remained in the banking sector but the Regional banking ETF (KRE) managed to gain +0.77% for the day. However, YTD, the entire sector looks weak with especially Goldman Sachs (GS) showing a loss of -9.91%.

Take a look at this chart, which compares YTD performance of Wall Street’s “darling banking stocks” vs. the banking index:

Read More