ETF Tracker Newsletter For June 2, 2017

Ulli ETF Tracker Contact

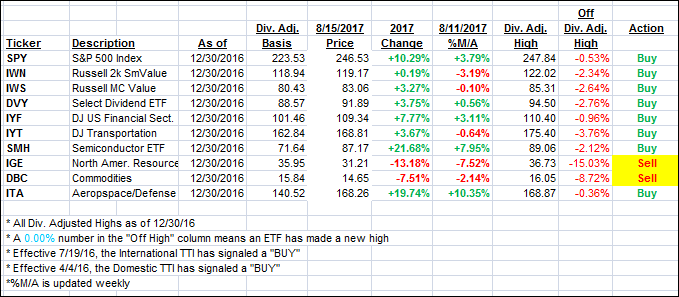
ETF Tracker StatSheet

https://theetfbully.com/2017/06/weekly-statsheet-etf-tracker-newsletter-updated-06012017/

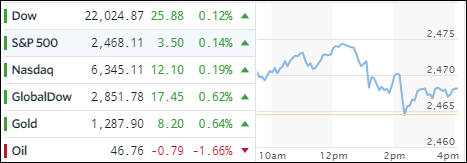
SAME OLD STORY: ANY NEWS IS GOOD NEWS FOR THE MARKETS

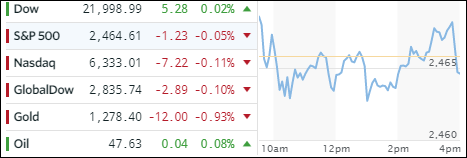
[Chart courtesy of MarketWatch.com]
  1. Moving the Markets

After yesterday’s euphoric reaction to ADP’s private sector hiring report, reality set in this morning when the BLS released the May jobs report showing that only a disappointing 138k jobs were added in May, which was far below the estimated number of 185k. To add insult to injury, April’s chest pounding number of 211k was revised substantially lower to only 174k. Those numbers suggest that the Fed’s “evidence,” that the current economic slowdown was just “transitory,” blew up in smoke. Even March’s payrolls were revised down from 79k to 50k.

These figures alone should have sent the market into a corrective spiral, but no, in this new normal environment, any news is good for equities and up we went without looking back, allowing the major indexes to add to yesterday’s gains by making new all-time highs.

Then we saw some of these headlines:

  • Retail carnage continues as sector loses jobs for fourth straight month
  • Full-time Jobs Tumble by 367,000; biggest drop in three years
  • JPM: There is a cloud hanging over the equity rally, but stocks don’t seem to mind (for now)
  • Bof A: The “QE Monster” only ends when “The Wall Street Bubble” finally shocks the Fed
  • Deutsche Bank trader admits to rigging precious metals markets

None of these were exactly soothing, but there appeared to be simply no way today to bring the markets down or keep them from scoring new highs. Macro data along with hard and soft data had an ugly weak with soft data sinking to a 6-month low.

The yield on the 10-year Treasury collapsed to 2.15%, its lowest since the election, while the Dollar index (UUP) lost another -0.48%, a low which was last seen the beginning of October 2016. That helped gold continue its rally, and the metal is now honing in on the $1,300 level again.

Read More

Weekly StatSheet For The ETF Tracker Newsletter – Updated Through 06/01/2017

Ulli ETF StatSheet Contact

ETF Data updated through Thursday, June 1, 2017

Methodology/Use of this StatSheet:

  1. From the universe of over 1,800 ETFs, I have selected only those with a trading volume of over $5 million per day (HV ETFs), so that liquidity and a small bid/ask spread are assured.
  2. Trend Tracking Indexes (TTIs)

Buy or Sell decisions for Domestic and International ETFs (section 1 and 2), are made based on the respective TTI and its position either above or below its long-term M/A (Moving Average). A crossing of the trend line from below accompanied by some staying power above constitutes a “Buy” signal. Conversely, a clear break below the line constitutes a “Sell” signal. Additionally, I use a 7.5% trailing stop loss on all positions in these categories to control downside risk.

  1. All other investment arenas do not have a TTI and should be traded based on the position of the individual ETF relative to its own respective trend line (%M/A). That’s why those signals are referred to as a “Selective Buy.” In other words, if an ETF crosses its own trendline to the upside, a “Buy” signal is generated. Since these areas tend to be more volatile, I recommend a wider trailing sell stop of 7.5% -10% depending on your risk tolerance.

If you are unfamiliar with some of the terminology, please see Glossary of Terms and new subscriber information in section 9.


  1. DOMESTIC EQUITY ETFs: BUY — since 4/4/2016

Click on chart to enlarge

Our main directional indicator, the Domestic Trend Tracking Index (TTI-green line in the above chart) is positioned above its long-term trend line (red) by +4.03% after having generated a new Domestic Buy signal effective 4/4/2016 as posted.

Read More

Afternoon Rally Starts June With A Bang

Ulli Uncategorized Contact

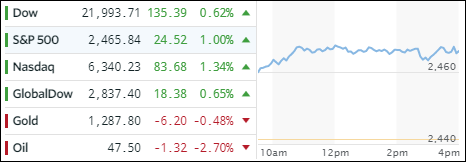
[Chart courtesy of MarketWatch.com]
  1. Moving the Markets

Private sector hiring as reported by ADP, which added a seasonally adjusted and bigger–than-expected 253k rise in employment for May, set the tone for the market, as the major indexes climbed steadily above the unchanged line and into record territory.

As has been the case in the recent past, negative news like US construction spending plunging in April by -1.4%, worse than the weakest expectations, along with a drop in US manufacturing to 8-month lows, were ignored as euphoria about a potentially strong jobs report due out tomorrow took center stage.

All three major indexes gained solidly and even SmallCaps, which have been lagging recently, managed to rebound and gained +1.76% on the day, which was their best day since the election. MidCaps joined the party by gaining +1.39%. Also, the trailing Dow finally hit a new record for the first time since March 1st.

Financials recovered from the recent bloodbath with the Regional Banking Index (KRE) recovering +1.78% from its recent losses. YTD, only 2 of the major banks are showing green numbers (BAC, MS), while JPM and GS are stuck below the unchanged line led by GS with a loss of -9.67%. Interest rates were steady, and the US Dollar (UUP) managed to eke out a tiny gain of +0.12%.

Read More

Closing Out May On A Weak Note

Ulli Market Commentary Contact

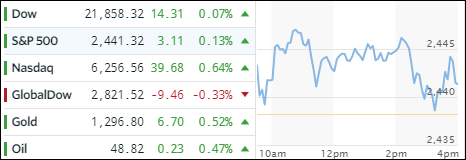
[Chart courtesy of MarketWatch.com]
  1. Moving the Markets

For the second day in a row, the major indexes limped slightly lower but ended up closing the out the month on the plus side. The Nasdaq took the lead with +2.5%, followed by the S&P 500 with +1.2%, while the Dow desperately hung on to the unchanged line but conquering it by a scant +0.3%.

The economic hits kept coming even though I don’t particularly look for them. Financials headed south, because two of the largest banks (JPM, BofA) signaling a trading slow down, warning  that revenue will be down as much as 15%, pushing them into the red YTD. Macro data collapsed for the second month in a row, the biggest sequential drop in US economic conditions since May 2011, according to ZH.

Pending home sales in April hit the skids and tumbled 5.4% YoY, which is their biggest drop since the middle of 2014. Crude Oil tanked again and appears to be firmly stuck below the $50 level. Interest rates slipped with the 10-year T-Bond (TLT) gaining +0.25%. The US Dollar (UUP) headed lower losing -0.24% today but gave back -2.1% for May; it’s down YTD by -5.3%.

Read More

Going Nowhere Fast

Ulli Market Commentary Contact

[Chart courtesy of MarketWatch.com]
  1. Moving the Markets

The markets seemed to have a hangover after the 3-day weekend with the major averages remaining stuck below the unchanged line giving back  some of last week’s gains.

Macro data continues to head south as consumer confidence dropped to its weakest since February confirming that hope has faded as evidenced by plans to buy homes, cars and major appliances, which hit their lowest level of the year.

No helping the mood on Wall Street are, and have been, appearances by banks and heavyweight money managers warning that Fed re-normalization could send equities 30% lower with BofA being the latest. Then famous hedge fund guru Paul Singer opined this morning that “All Hell Will Break loose” by issuing this:

Given group think and the determination of policy makers to do ‘whatever it takes’ to prevent the next market ‘crash,’ we think that the low-volatility levitation magic act of stocks and bonds will exist until the disenchanting moment when it does not. And then all hell will break loose (don’t ask us what hell looks like…), a lamentable scenario that will nevertheless present opportunities that are likely to be both extraordinary and ephemeral. The only way to take advantage of those opportunities is to have ready access to capital.

Surely, none of this helped the markets, and it appears that after the recent gains, which wiped out May’s mid-month losses, we will silently fade into the last day of May tomorrow.

Read More

One Man’s Opinion: Legendary Investor Asher Edelman Says “I Have No Doubt” PPT Behind Market Rally

Ulli Market Review Contact

By ZeroHedge

Legendary vulture investor Asher Edelman, the 1980s model for Gordon Gekko, strayed into what must’ve been uncomfortable territory for CNBC during an appearance on “Smart Money” when he discussed his view that the government’s “plunge protection team” is the only thing propping up the current market rally, and said he suspects that it has again been recently een intervening in the market to keep stocks at record highs.

Edelman simply notes that he doesn’t want to be in the markets right now because “I don’t know when the plug is going to be pulled.”

Few can explain the market’s recent resilience, holding near record highs despite weak economic data and intensifying geopolitical tensions. The main benchmarks have risen for the fourth straight day following last week’s “Trump Dump” despite a terror attack in the U.K., the worst soft economic data since February 2016, and surprisingly low trading volume.

Read More