
- Moving the Markets
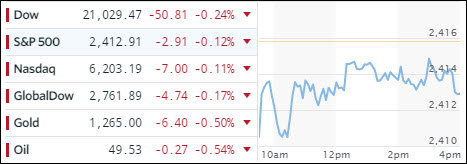
The markets seemed to have a hangover after the 3-day weekend with the major averages remaining stuck below the unchanged line giving back some of last week’s gains.
Macro data continues to head south as consumer confidence dropped to its weakest since February confirming that hope has faded as evidenced by plans to buy homes, cars and major appliances, which hit their lowest level of the year.
No helping the mood on Wall Street are, and have been, appearances by banks and heavyweight money managers warning that Fed re-normalization could send equities 30% lower with BofA being the latest. Then famous hedge fund guru Paul Singer opined this morning that “All Hell Will Break loose” by issuing this:
Given group think and the determination of policy makers to do ‘whatever it takes’ to prevent the next market ‘crash,’ we think that the low-volatility levitation magic act of stocks and bonds will exist until the disenchanting moment when it does not. And then all hell will break loose (don’t ask us what hell looks like…), a lamentable scenario that will nevertheless present opportunities that are likely to be both extraordinary and ephemeral. The only way to take advantage of those opportunities is to have ready access to capital.
Surely, none of this helped the markets, and it appears that after the recent gains, which wiped out May’s mid-month losses, we will silently fade into the last day of May tomorrow.
- ETFs in the Spotlight (updated for 2017)
In case you missed the announcement and description of this section, you can read it here again.
It features 10 broadly diversified and sector ETFs from my HighVolume list as posted every Saturday. Furthermore, they are screened for the lowest MaxDD% number meaning they have been showing better resistance to temporary sell offs than all others over the past year.
The below table simply demonstrates the magnitude with which some of the ETFs are fluctuating in regards to their positions above or below their respective individual trend lines (%M/A). A break below, represented by a negative number, shows weakness, while a break above, represented by a positive percentage, shows strength.
For hundreds of ETF choices, be sure to reference Thursday’s StatSheet.
Year to date, here’s how the 2017 candidates have fared so far:
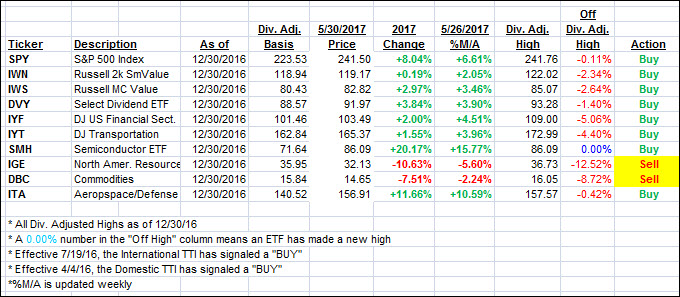
Again, the %M/A column above shows the position of the various ETFs in relation to their respective long term trend lines, while the trailing sell stops are being tracked in the “Off High” column. The “Action” column will signal a “Sell” once the -7.5% point has been taken out in the “Off High” column.
- Trend Tracking Indexes (TTIs)
Our Trend Tracking Indexes (TTIs) faded a tad as the major indexes were stuck below the unchanged line throughout the session.
Here’s how we closed 5/30/2017:
Domestic TTI: +3.66% (last close +3.68%)—Buy signal effective 4/4/2016
International TTI: +8.12% (last close +8.34%)—Buy signal effective 7/19/2016
Disclosure: I am obliged to inform you that I, as well as my advisory clients, own some of the ETFs listed in the above table. Furthermore, they do not represent a specific investment recommendation for you, they merely show which ETFs from the universe I track are falling within the guidelines specified.
Contact Ulli