
- Moving the market
The major indexes opened flat and remained close to their initial levels in early trading, as Wall Street awaited updates on trade deal negotiations.
While the Treasury Secretary mentioned productive discussions with Japan and hinted at a potential “framework” agreement with India, the absence of details regarding China put pressure on the markets.
General Motors saw a decline despite reporting better-than-expected profits, as the automaker announced it was reassessing future guidance and suspending additional share buybacks due to uncertainties surrounding levies and rising global tensions.
Big Tech will be in the spotlight tomorrow and Thursday, with Meta, Microsoft, Apple, and Amazon set to report their quarterly results.
Of the more than 36% of S&P 500 companies that have reported so far this season, approximately 73% have exceeded expectations, according to FactSet. This is slightly below the 5-year average of 77%.
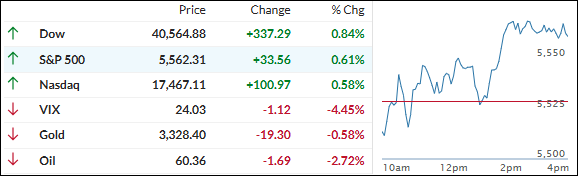
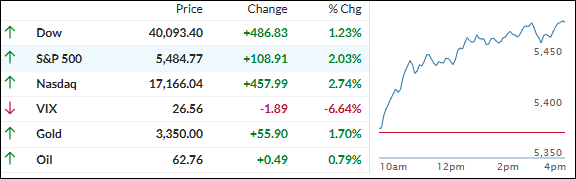
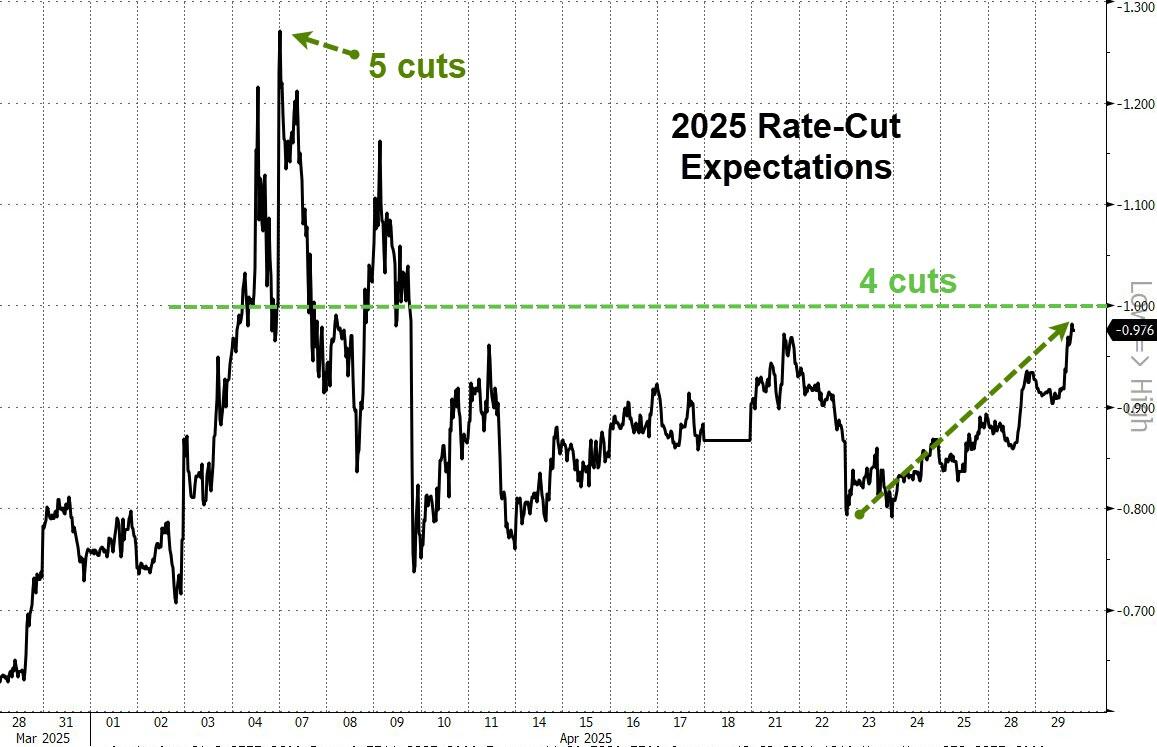
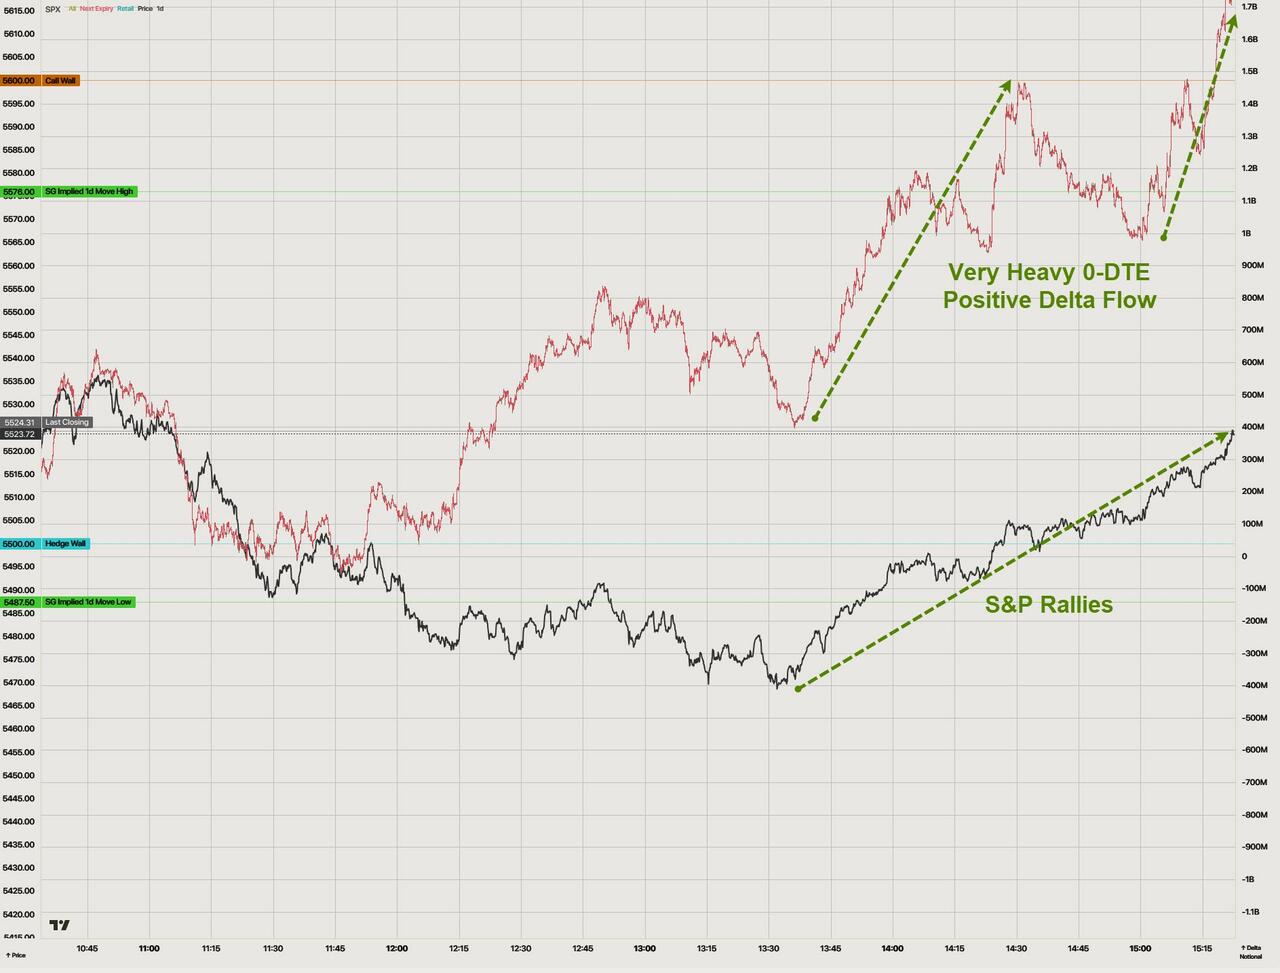
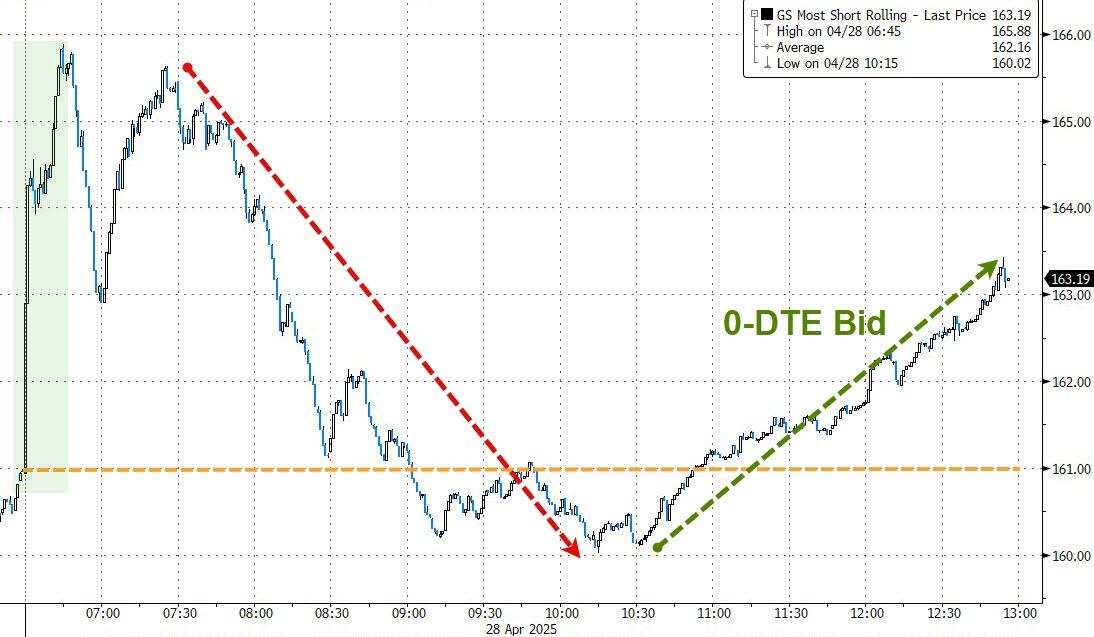
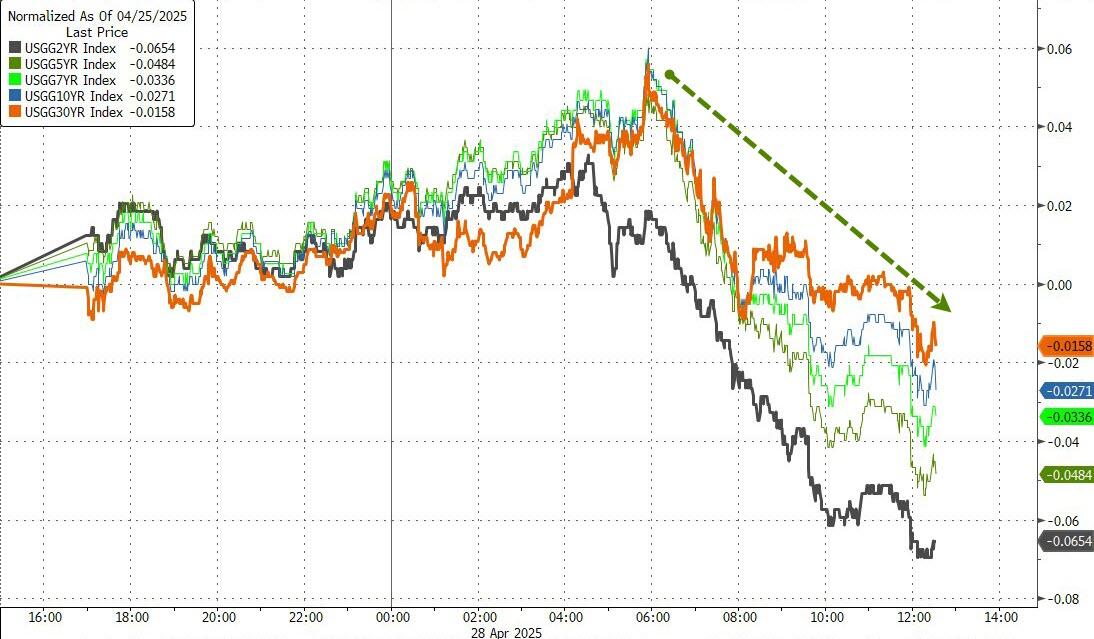
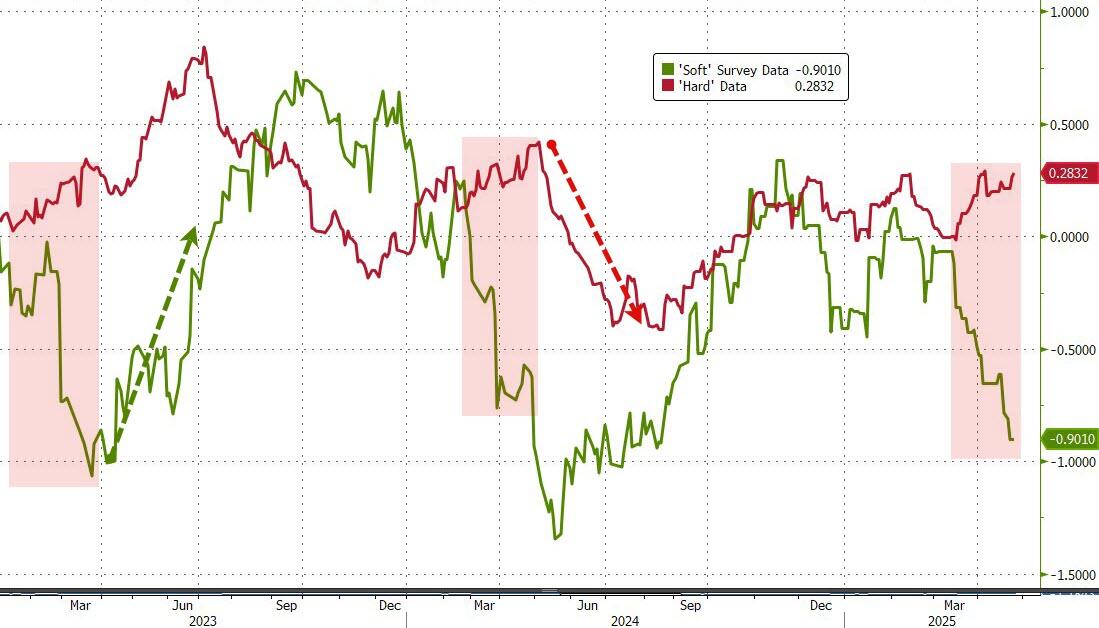
Despite market volatility, bullish sentiment emerged midday, leading to a rebound and another positive close for the major indexes. The theme of the day was “bad news is good news,” as weak macroeconomic data increased expectations for rate cuts.
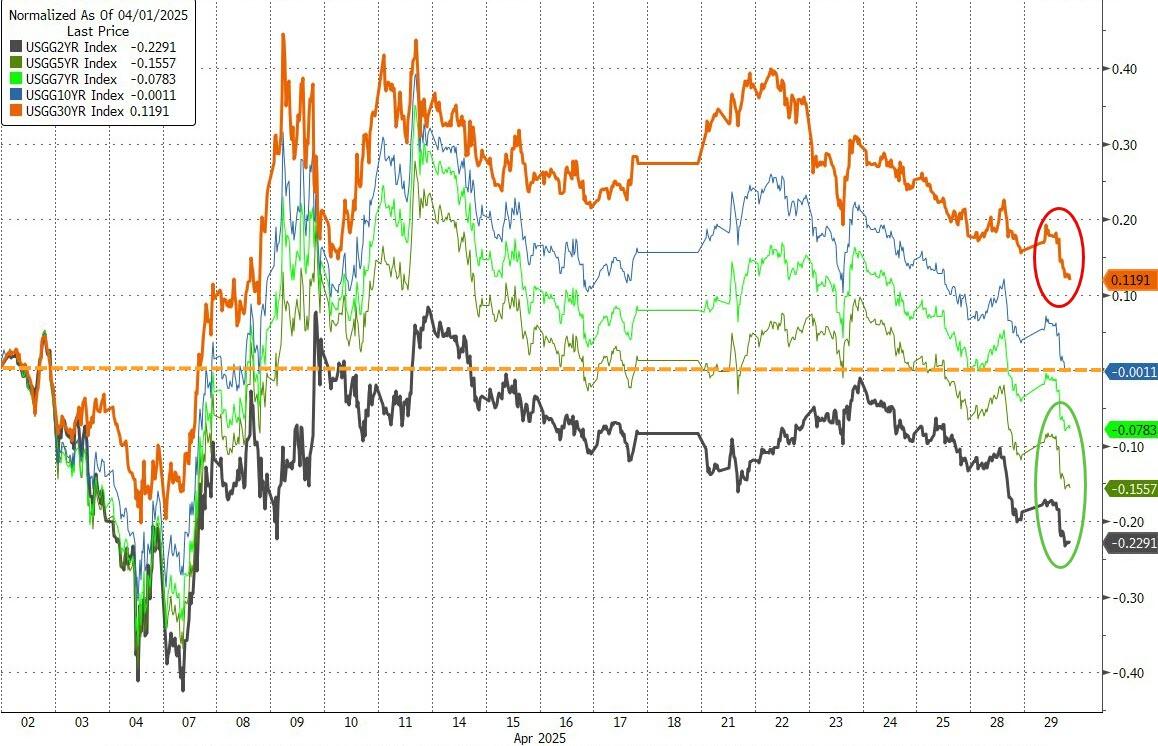
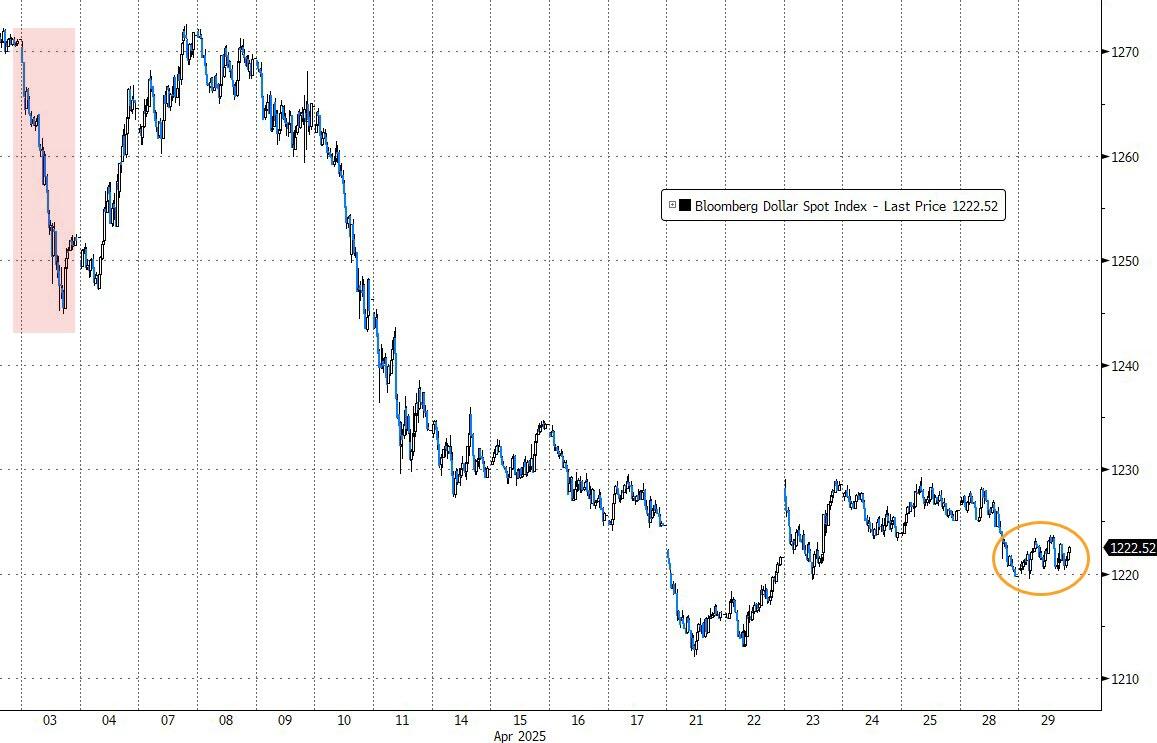
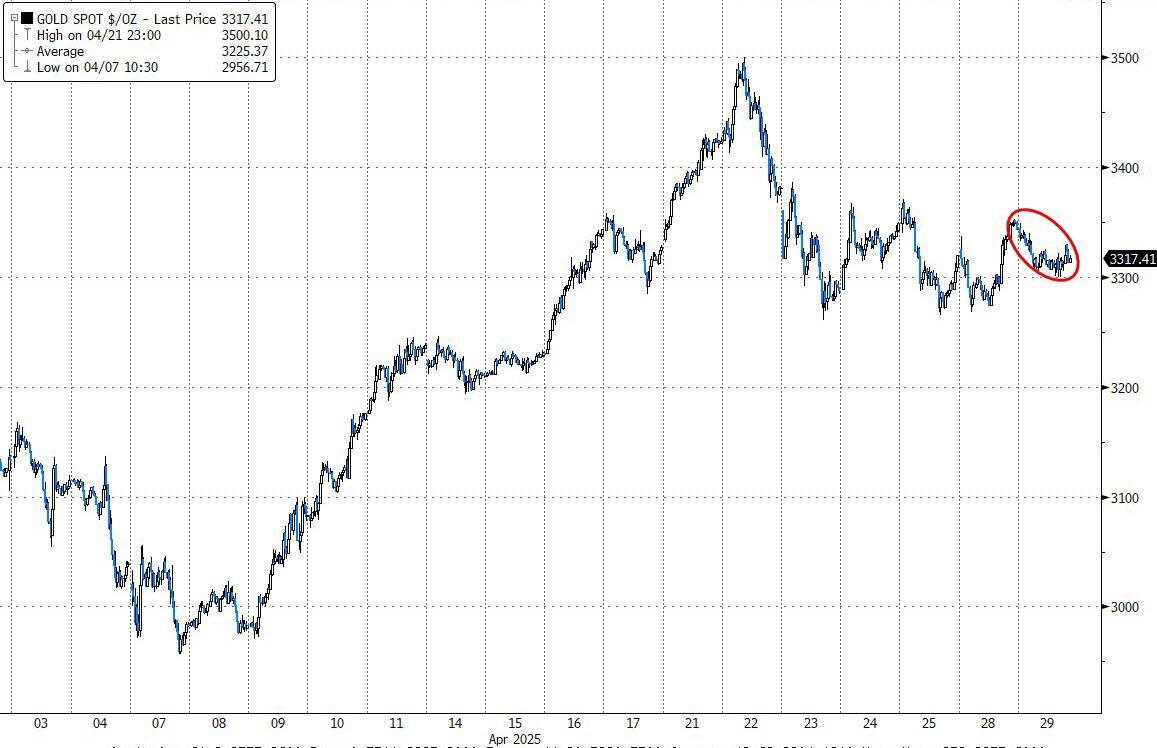
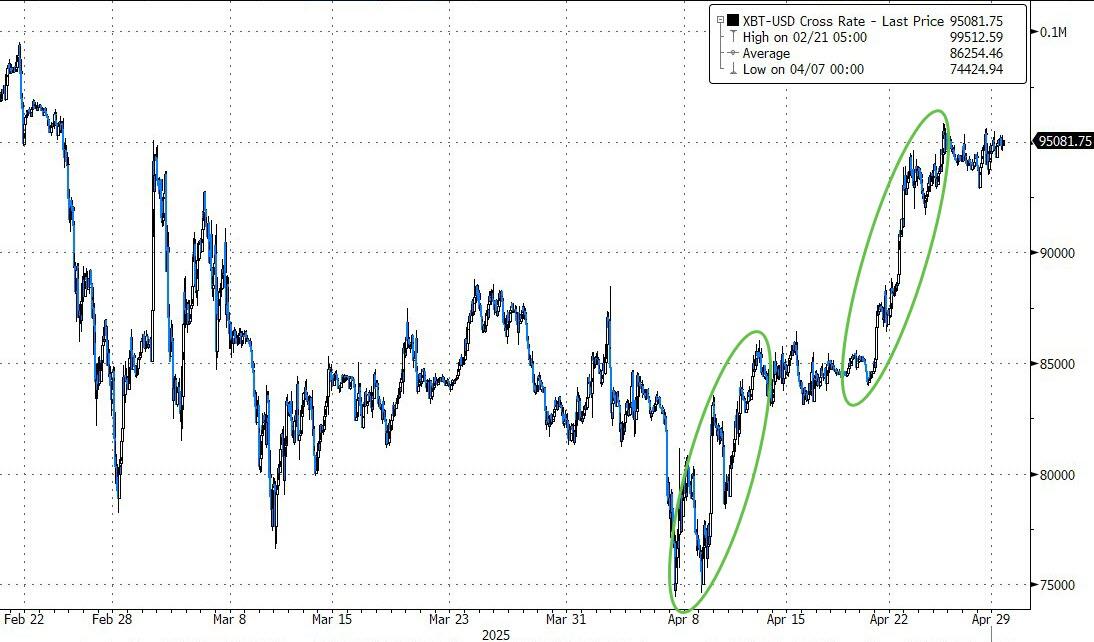
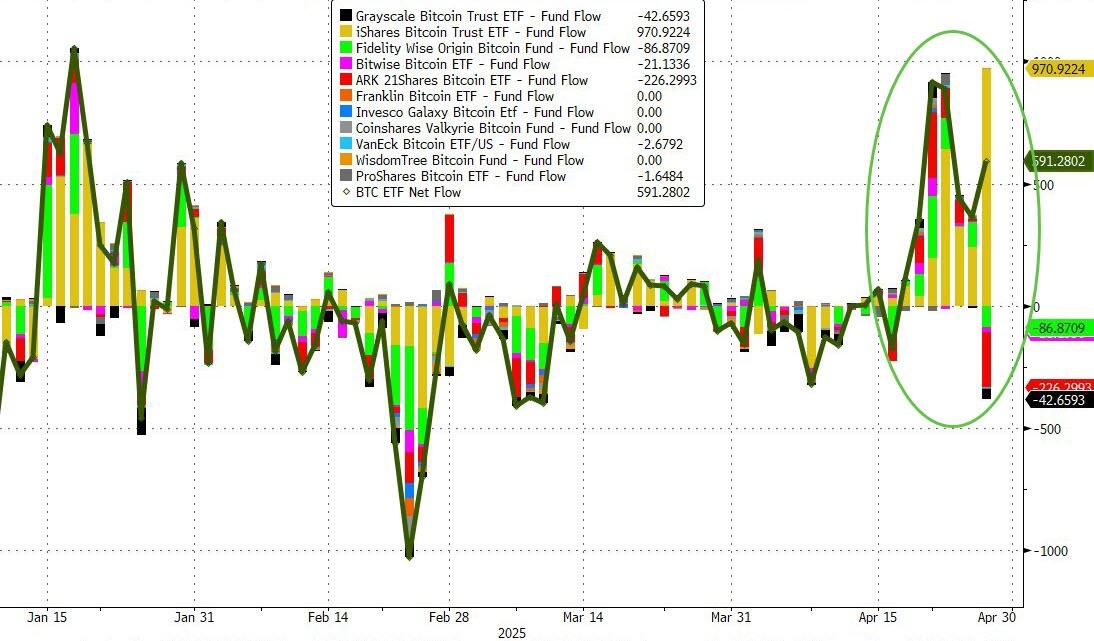
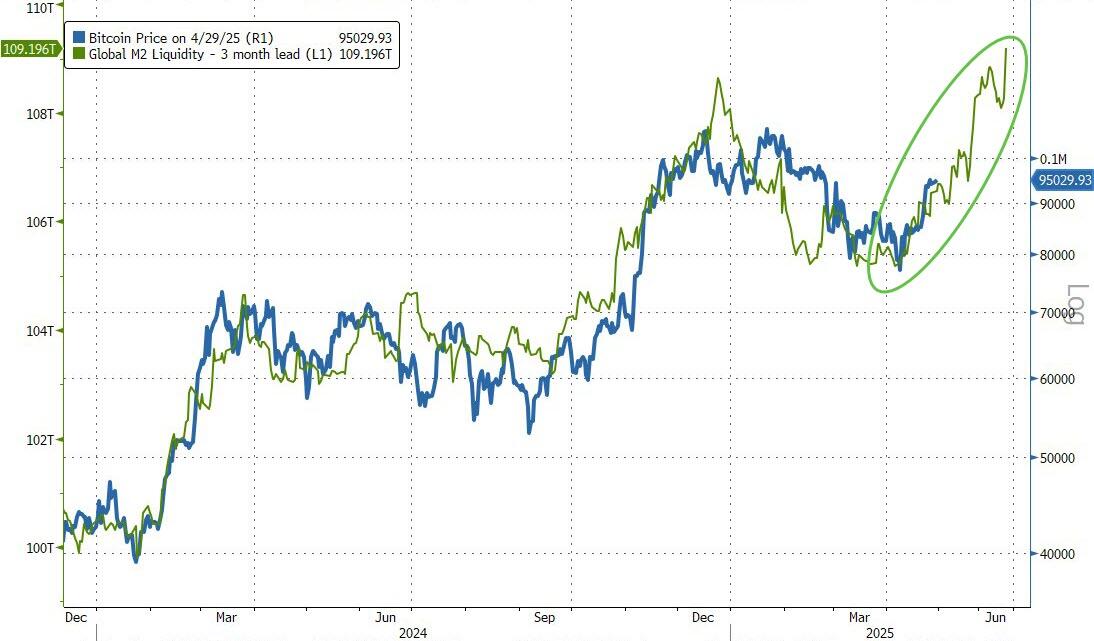
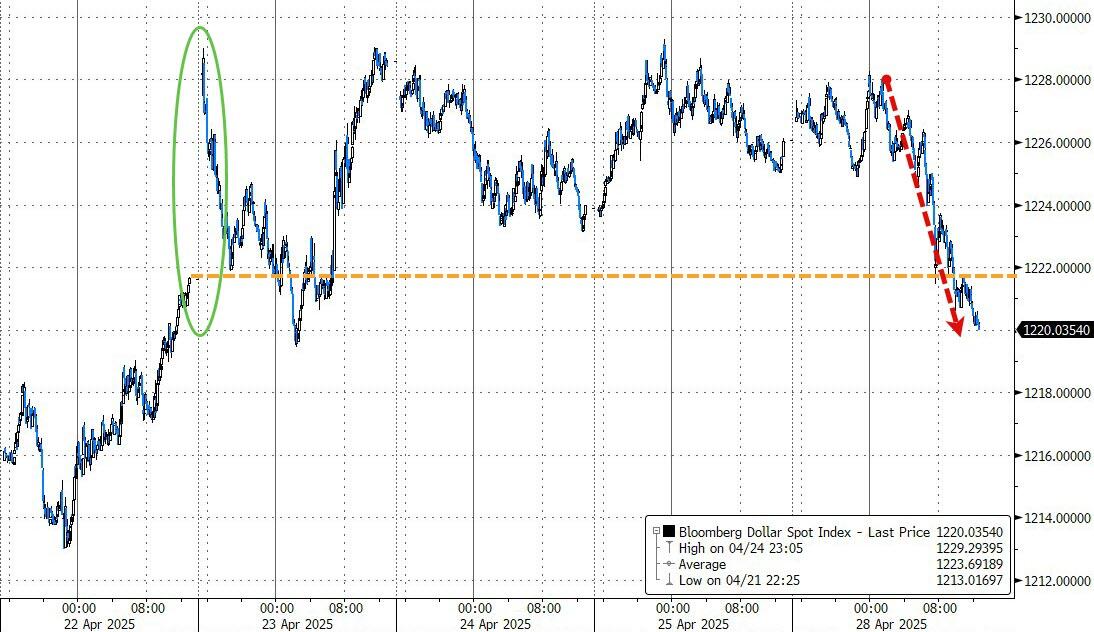
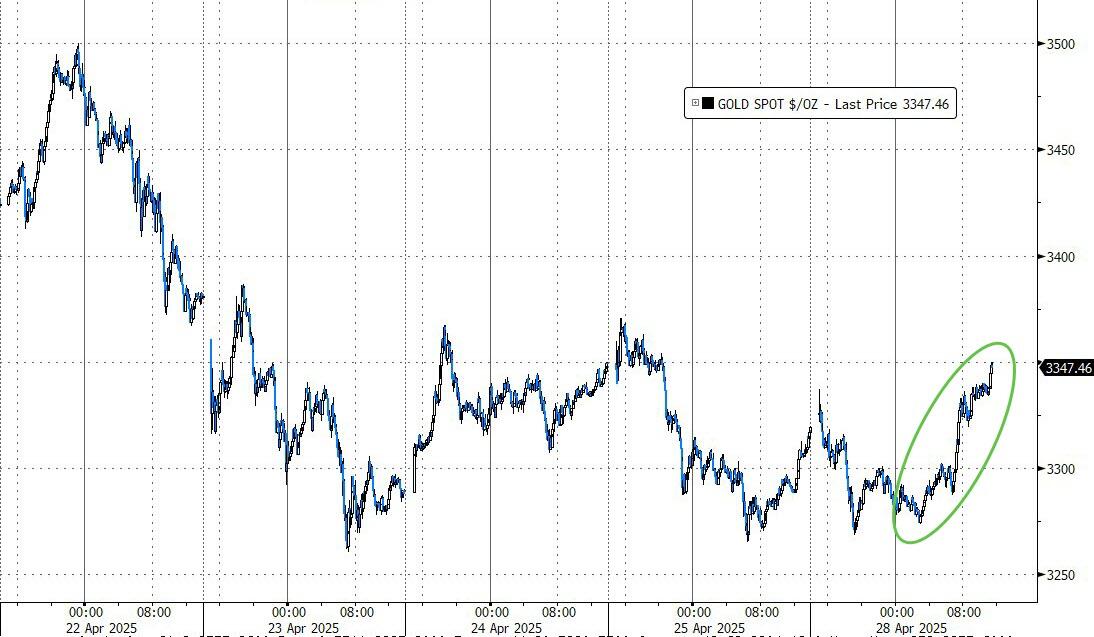
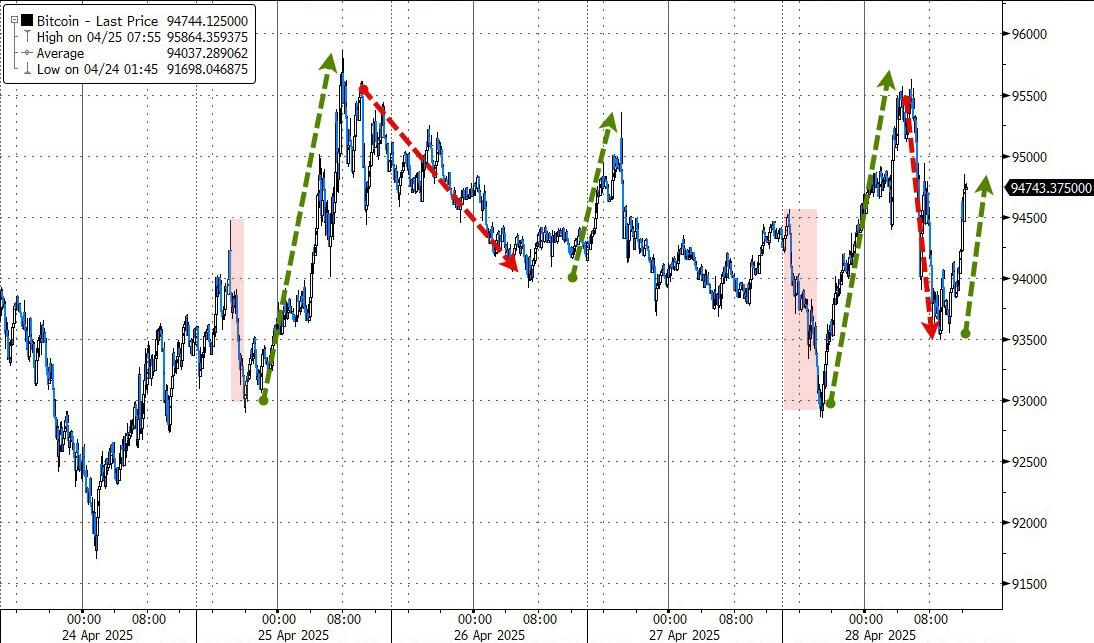
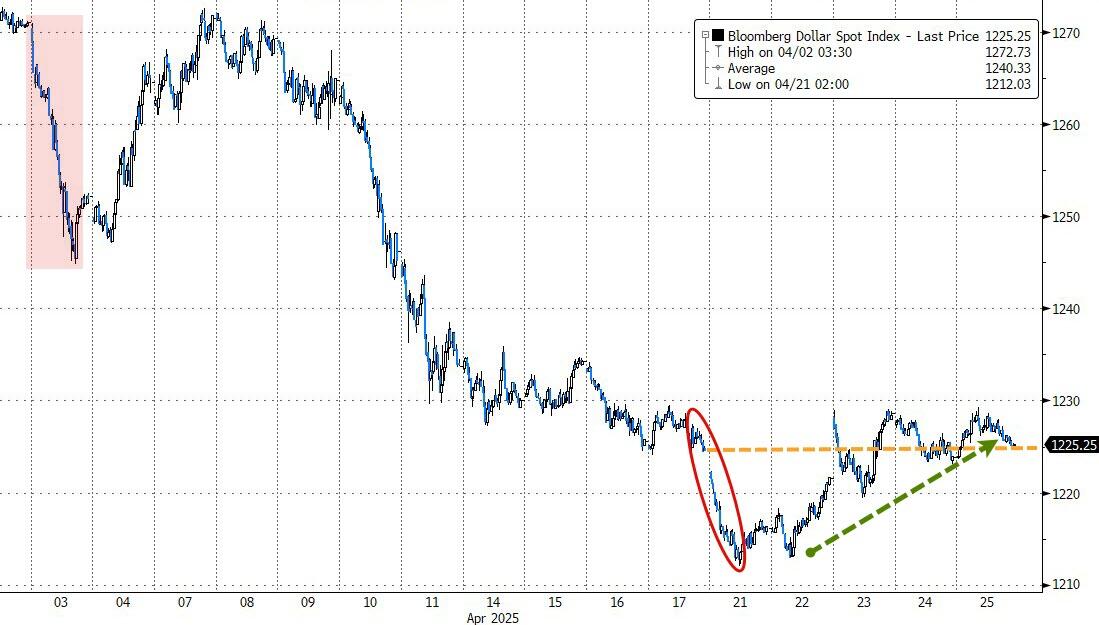
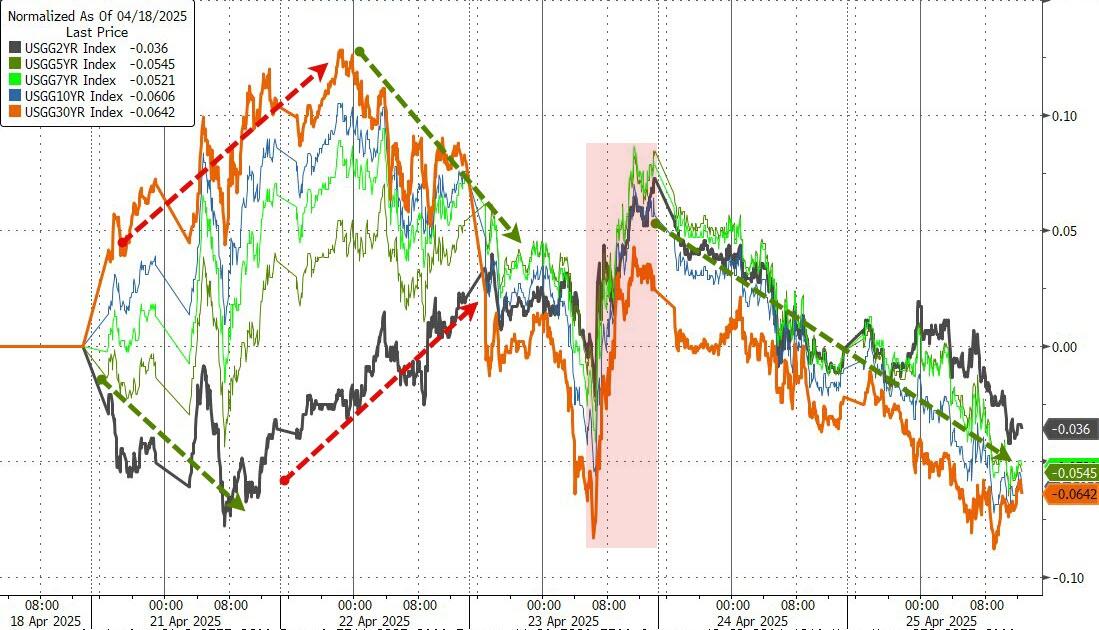
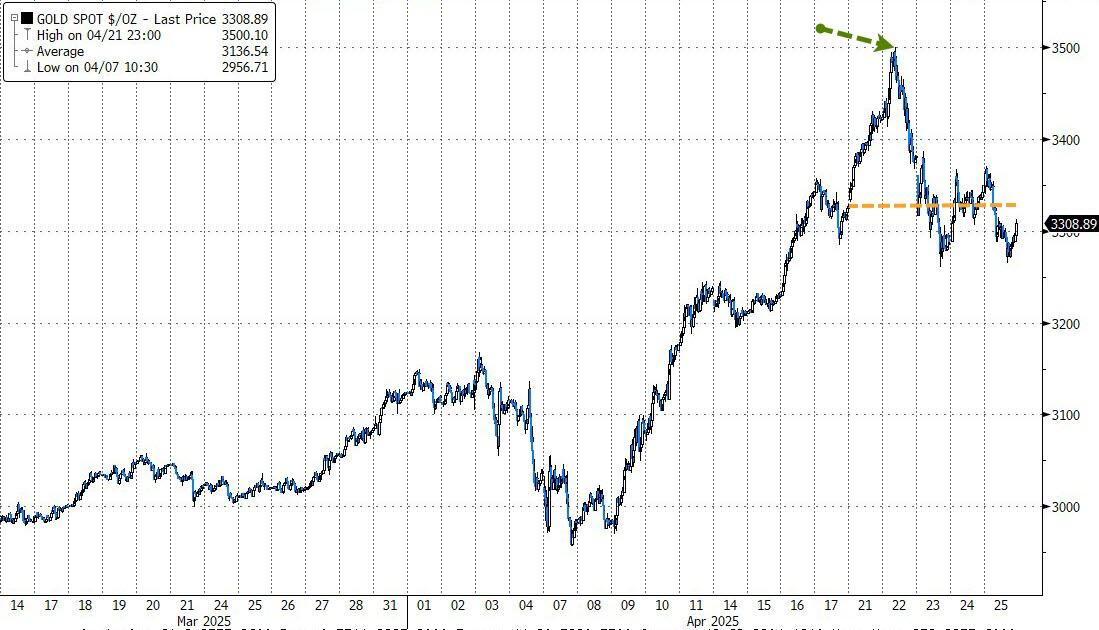
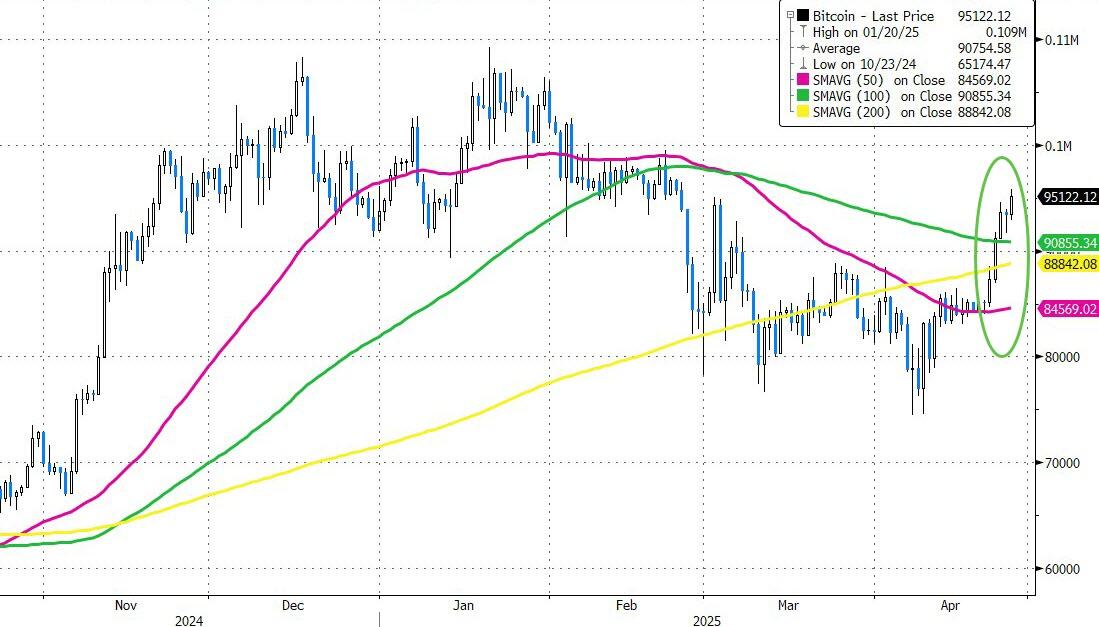
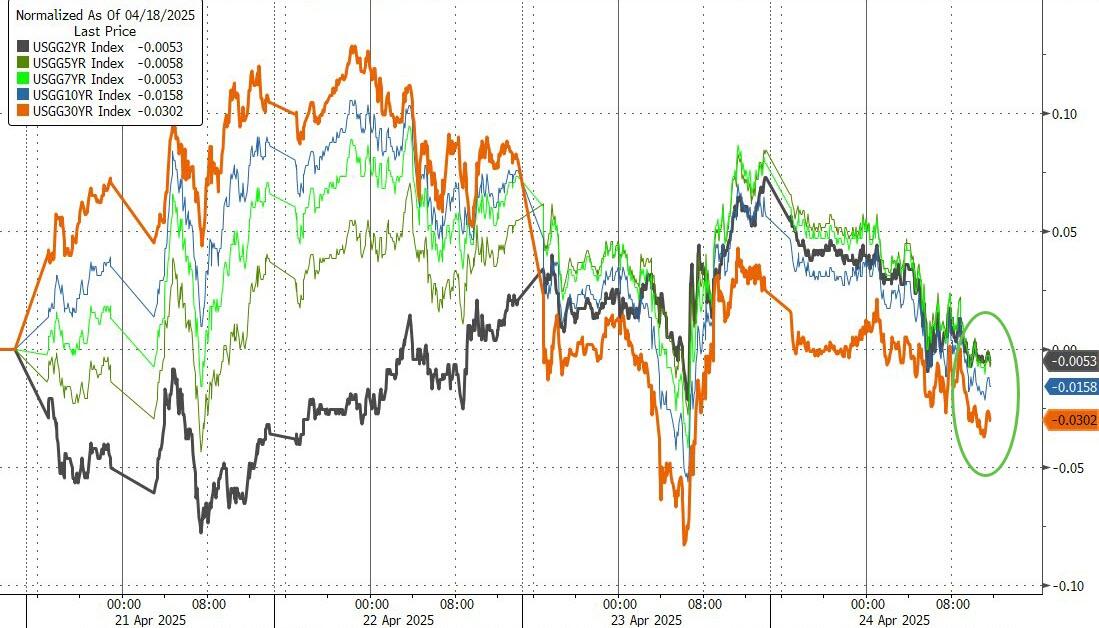
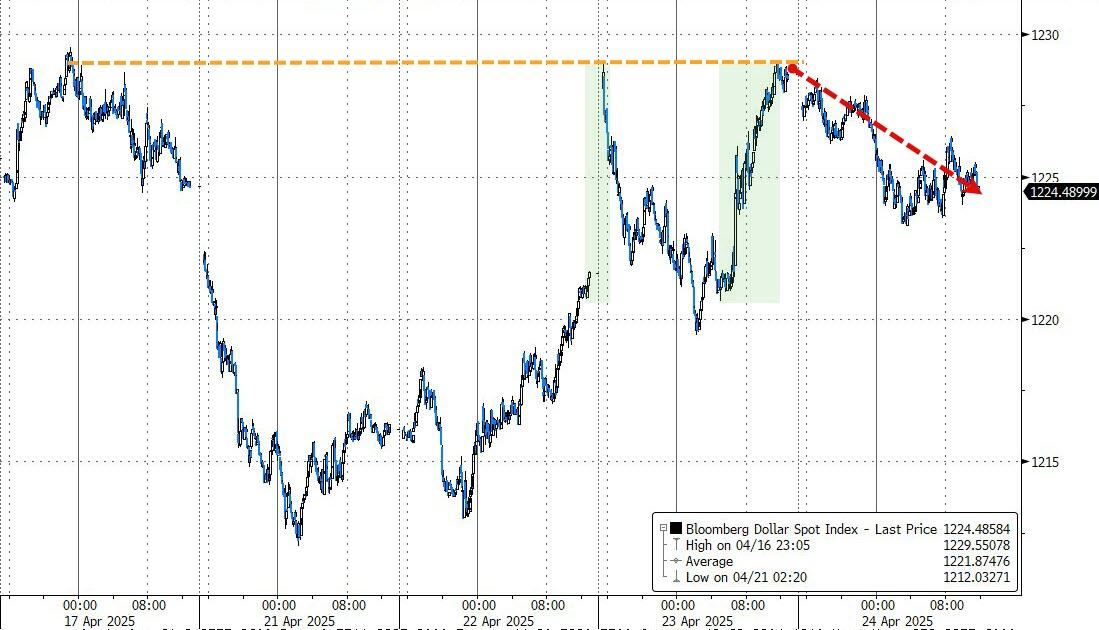
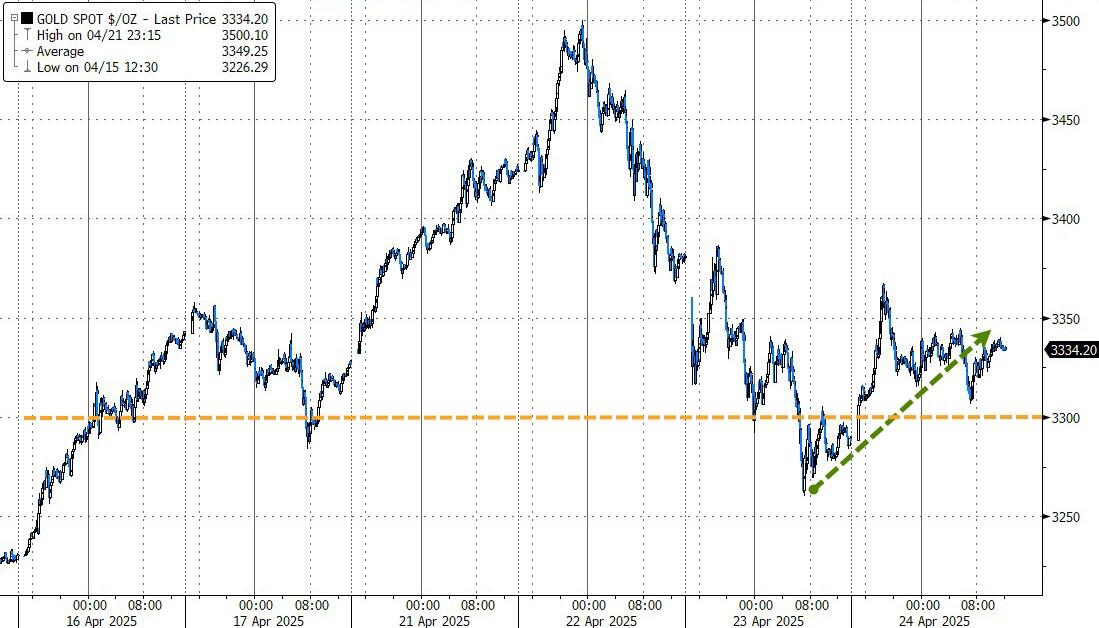
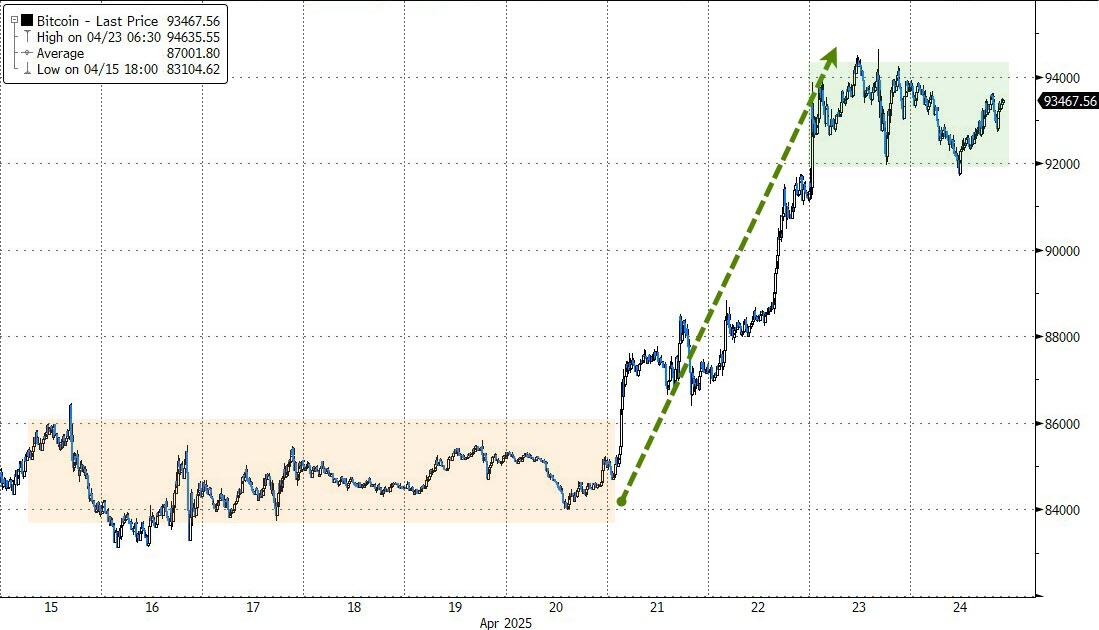
Bond yields fell again, the dollar remained stable, but gold slipped while successfully defending its $3,300 level. Bitcoin edged higher, maintaining its $95k level, and continued to see significant inflows into its ETFs.
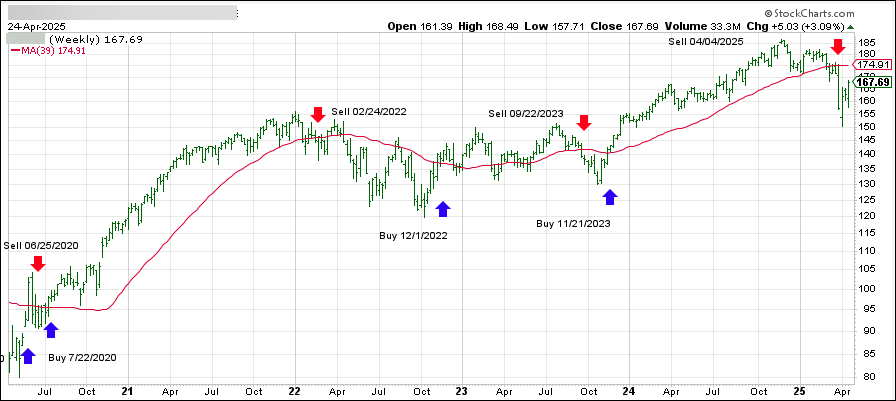
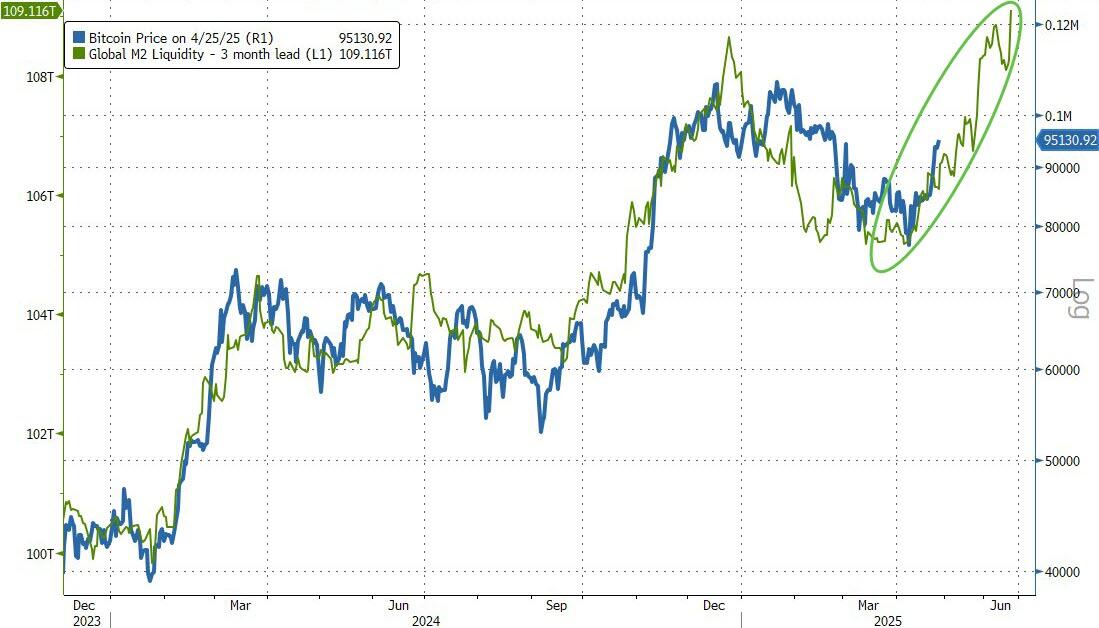
Have traders and investors recognized this chart, which seems to indicate that Bitcoin’s next major advance is imminent?
Read More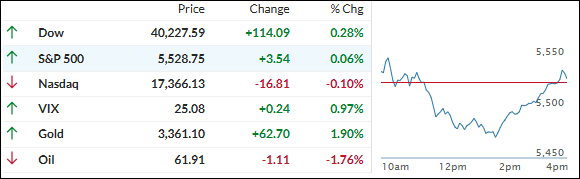
