
ETF Tracker StatSheet
You can view the latest version here.
MARKET MADNESS: STOCKS AND BONDS SWING WILDLY ON JOBS REPORT
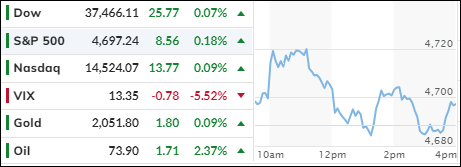
[Chart courtesy of MarketWatch.com]
- Moving the markets
The stock market had another day of mixed signals, as investors tried to make sense of the latest economic news.
After a morning rally, the major indexes gave up most of their gains by the afternoon but managed to end the day slightly higher.
The main catalyst for the market mood swings was the December jobs report, which showed that the U.S. economy added 216,000 new jobs, beating the forecast of 170,000. That sounds like good news, right?
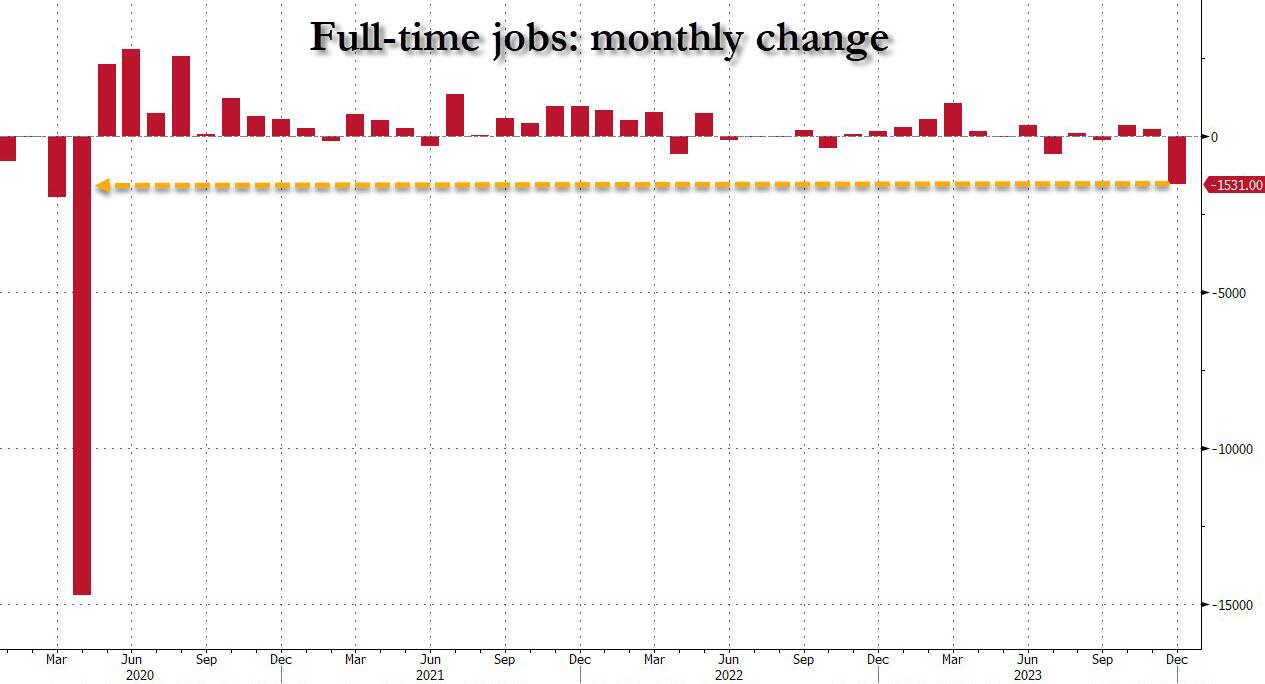
Well, not so fast. A closer look at the data revealed that full-time jobs plunged by a record 1.5 million, while part-time and multiple jobs soared to new highs. So much for the quality of work. The jobs report also sent bond yields on a wild ride, with the 10-year Treasury rate jumping to 4.06% before settling at 4.4%.
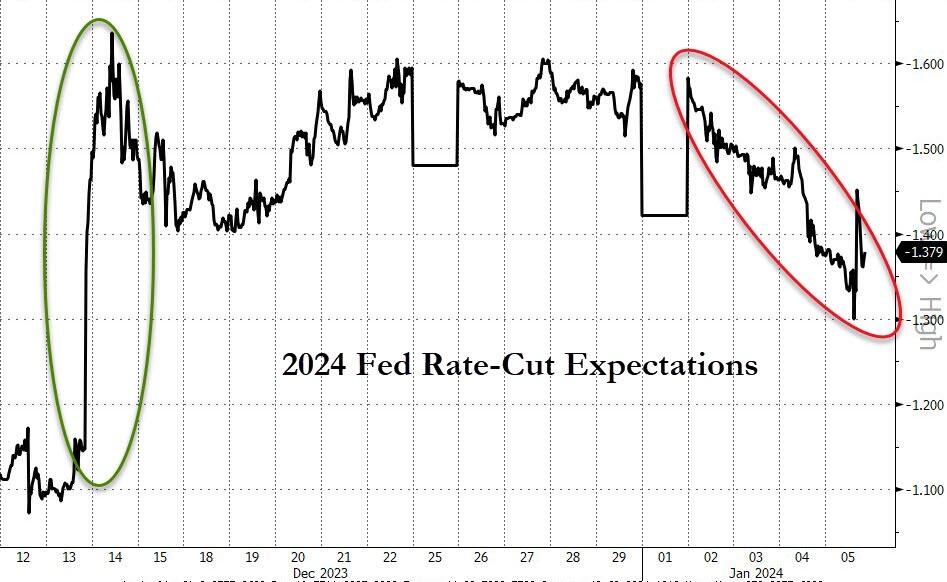
Higher yields mean higher borrowing costs, which could dampen the economic growth prospects. They also mean that the Fed might rethink its plans to cut interest rates, which the market has been counting on.
Before Friday, traders were betting that the Fed would slash rates as soon as March and as many as six times in 2024. Now, they are not so sure.
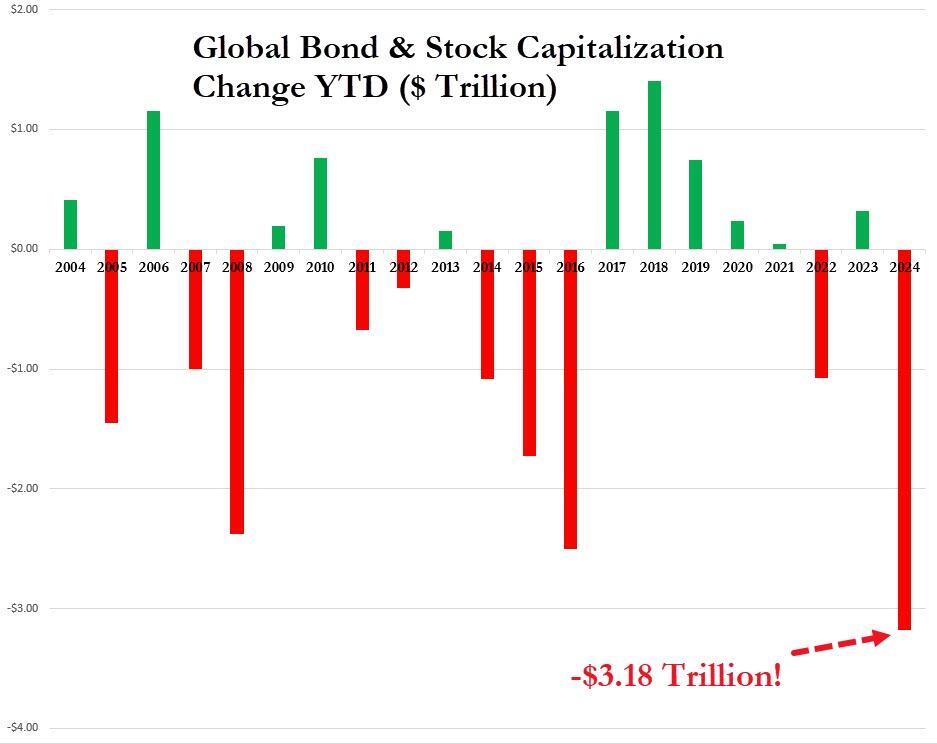
The market jitters were not limited to the U.S., as global stocks and bonds had their worst start to a year ever, losing over $3 trillion in value. That’s more than the GDP of France in case you were wondering.
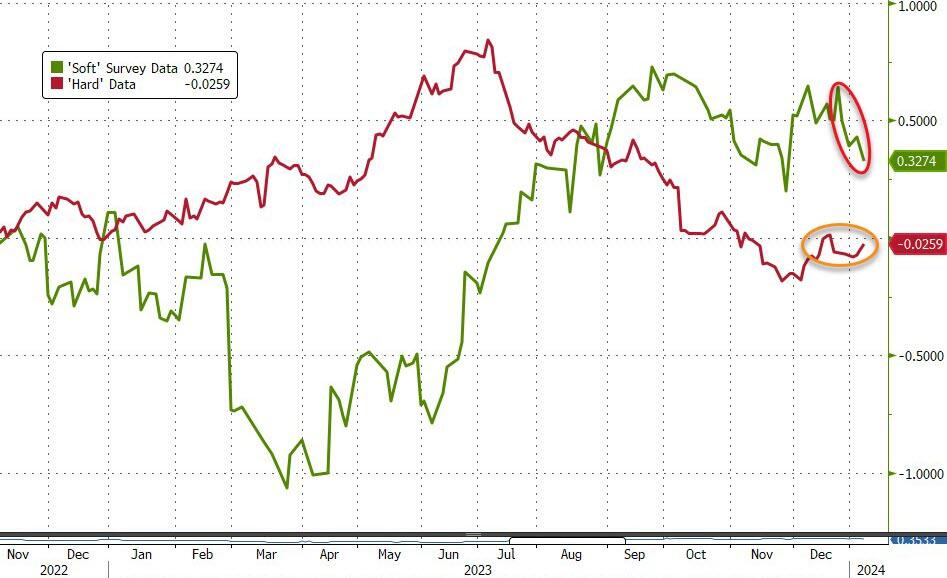
The bleak outlook was reflected in the ‘soft’ data, such as surveys and sentiment indicators, which showed a sharp decline in confidence and expectations. The ‘hard’ data, such as actual production and sales, were already gloomy, so the gap between them is narrowing.
The tech giants, known as the MAG7, felt the pain more than most, as they lost $400 billion in market cap in one week, wiping out all their gains from December.
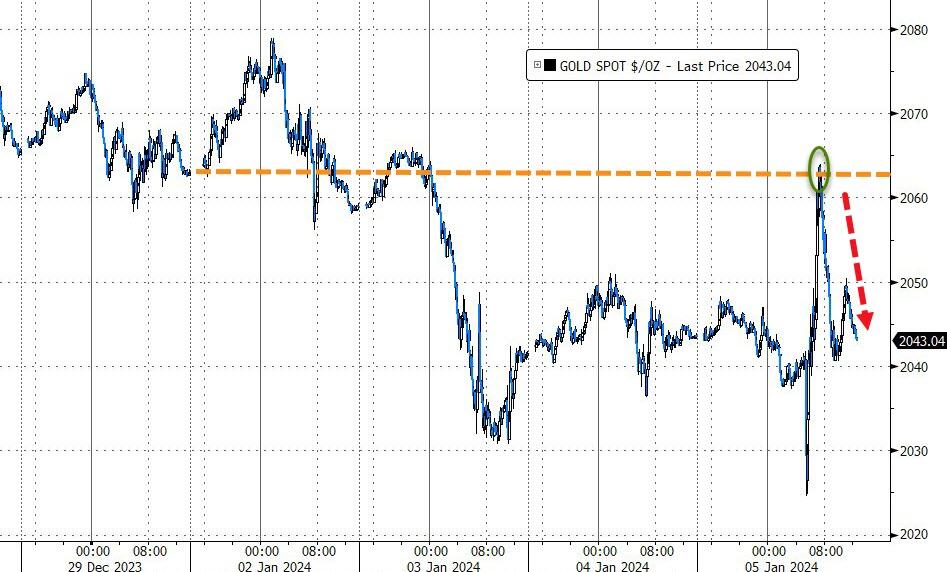
The dollar and gold also had a volatile day, as they reacted to the changing expectations of the Fed’s policy. The precious metal briefly turned positive, but then fell back.
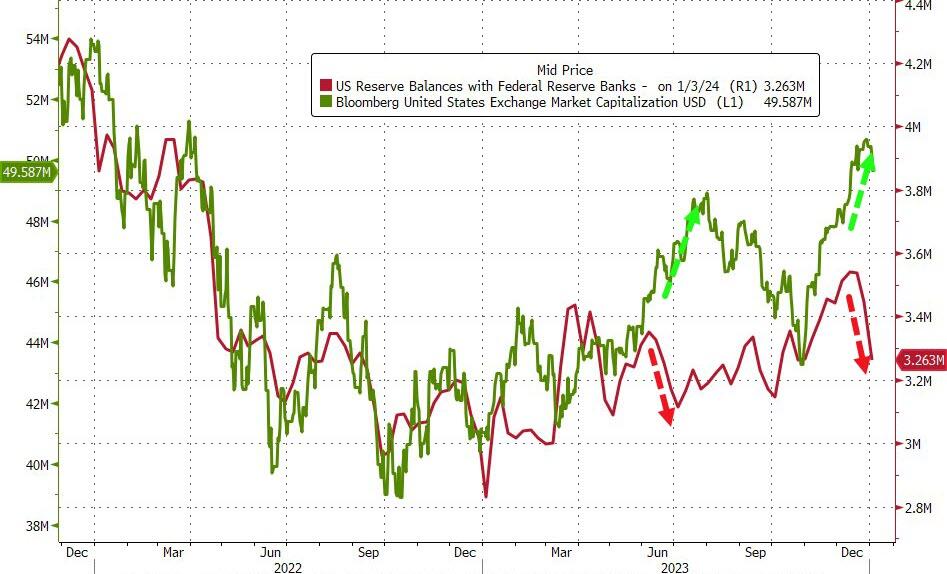
The market is clearly confused and uncertain about the direction of the economy and the Fed’s actions. One sign of this is the divergence between the Fed’s balance sheet, which is shrinking, and the market’s capitalization, which is growing. This chart shows the gap between them.
Something must give, so who will blink first?
2. Current “Buy” Cycles (effective 11/21/2023)
Our Trend Tracking Indexes (TTIs) have both crossed their trend lines with enough strength to trigger new “Buy” signals. That means, Tuesday, 11/21/2023, was the official date for these signals.
If you want to follow our strategy, you should first decide how much you want to invest based on your risk tolerance (percentage of allocation). Then, you should check my Thursday StatSheet and Saturday’s “ETFs on the Cutline” report for suitable ETFs to buy.
3. Trend Tracking Indexes (TTIs)
The major indexes recovered some of their losses in the final minutes of trading and closed slightly above their previous levels. However, they still ended the week with a net loss.
Our TTIs, which are indicators of the market trend, changed very little and stayed above their trend lines, signaling a bullish environment. This was despite dropping for three consecutive days in 2024.
This is how we closed 1/5/2024:
Domestic TTI: +6.83% above its M/A (prior close +6.80%)—Buy signal effective 11/21/2023.
International TTI: +6.53% above its M/A (prior close +6.49%)—Buy signal effective 11/21/2023.
All linked charts above are courtesy of Bloomberg via ZeroHedge.
———————————————————-
WOULD YOU LIKE TO HAVE YOUR INVESTMENTS PROFESSIONALLY MANAGED?
Do you have the time to follow our investment plans yourself? If you are a busy professional who would like to have his portfolio managed using our methodology, please contact me directly to get more details.
Contact Ulli