Going Nowhere For The Day But Gaining On The Month

Ulli Market Commentary Contact

[Chart courtesy of MarketWatch.com]
  1. Moving the Markets

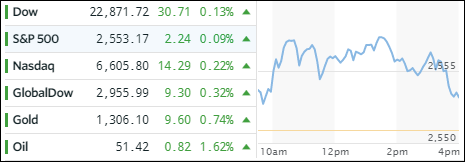
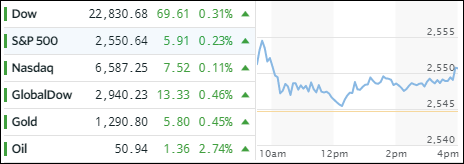
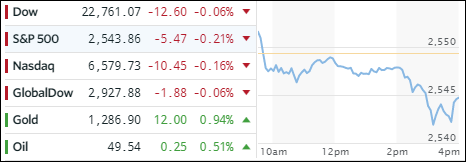
It was an uneventful last day of the month in the markets with the major indexes being content to more or less hug their respective unchanged lines with only the Dow pushing back into the green by a slight margin. For the month, the S&P 500 added +1.94% while the Nasdaq surged 3.5%.

The Dow notched its 5th record close in a row… thanks to Boeing. According to ZH, on the month, Boeing accounted for 310 of the Dow’s 570 point gain, which makes it more or less a one man show. Looking at some other favorites, the FANG stocks, despite some volatility, had their best month since October 2015 by gaining 10%. Here too, the main contributor was Netflix adding +22%.

The yield on the widely followed 10-year bond remained unchanged for the day but whipsawed throughout July. Crude oil danced to its own music and, after 4 straight down months, managed to score a 7% gain. Heading down into the basement best describes the action of the US dollar (UUP), which slid another -0.41% and is now honing in on the lows of 2016. The beneficiary of that slippage was gold, which had its best month since February and closing at its highest point since October 2016.

Read More

One Man’s Opinion: And The Best Performing Stock Market In The World Is. . .

Ulli Market Review Contact

By Simon Black

Pop quiz: What country has the world’s best performing stock market?

It’s not the United States. Or Canada. Or China.

The answer is Venezuela, whose primary stock market index over the last year is up nearly SEVEN FOLD, from 11,700 last summer to a record 72,700 today.

It’s amazing that a country where people are literally starving because there’s very little food available is seeing record stock market performance.

At face value it would seem that anyone who had invested in Venezuela stocks is an absolute genius and swimming in money right now.

But remember that Venezuelan stocks are denominated in local currency.

Officially the Bolivar’s exchange rate with the US dollar is around 10:1. But due to the country’s hyperinflation, the black market rate is closer to 6,000:1.

Read More

ETFs On The Cutline – Updated Through 07/28/2017

Ulli ETFs on the Cutline Contact

Below please find the latest High Volume ETFs Cutline report, which shows how far above or below their respective long-term trend lines (39 week SMA) my currently tracked ETFs are positioned.

This report covers the HV ETF Master List from Thursday’s StatSheet and includes 366 High Volume ETFs ETFs, defined as those with an average daily volume of more than $5 million, of which currently 287 (last week 285) are hovering in bullish territory. The yellow line separates those ETFs that are positioned above their trend line (%M/A) from those that have dropped below it.

Take a look:

The HV ETF Master Cutline Report            

In case you are not familiar with some of the terminology used in the reports, please read the Glossary of Terms.

If you missed the original post about the Cutline approach, you can read it here.

ETF Tracker Newsletter For July 28, 2017

Ulli ETF Tracker Contact

ETF Tracker StatSheet

https://theetfbully.com/2017/07/weekly-statsheet-etf-tracker-newsletter-updated-07272017/

DOW CLOSES AT RECORD; TECH IS WEIGHING ON S&P AND NASDAQ

[Chart courtesy of MarketWatch.com]
  1. Moving the Markets

Much of the retail store apocalypse has been blamed on online sales, despite the fact that they only account for about 8% of total retail sales. Amazon was one of the alleged guilty parties contributing to the consumer discretionary skid. Well, this morning Amazon stock took a -3.5% dive confirming in a way that lack of consumer spending, due to worsening economic conditions, may very well be at the core of the issue in addition to Amazon’s 77% plunge in second quarter earnings, a result of jumping operating expenses across the board.

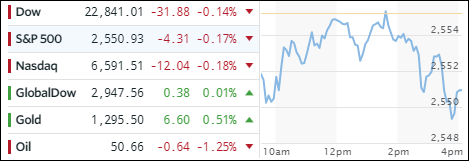
The early morning sell-off proved to be a tough one to reverse and, despite the VIX being crushed again (but it had its biggest weekly gain in 2 months), only the Dow managed to crawl above the unchanged line to set a new record close. The other two major indexes ended up slightly in the red with the S&P 500, to much shock and horror, actually losing 1 point for the week, after having chalked up 3 weekly gains in a row.

The FANG stocks had their first down week in the last 4; interest rates dropped today and also ended lower for the week. Not only did 2nd Qtr GDP miss at 2.6% vs. an expected 2.7%, but 1st Qtr GDP was revised down from 1.4% to 1.2%, which makes me curious as to what next month’s revision will bring.

The dollar index continued its dive losing another -0.62% for the day allowing gold to rally for the 3rd straight week and conquering its 50-, 100- and 200-day M/As to close at $1,275, its highest level since the beginning of June.

Read More

Weekly StatSheet For The ETF Tracker Newsletter – Updated Through 07/27/2017

Ulli ETF StatSheet Contact

ETF Data updated through Thursday, July 27, 2017

Methodology/Use of this StatSheet:

  1. From the universe of over 1,800 ETFs, I have selected only those with a trading volume of over $5 million per day (HV ETFs), so that liquidity and a small bid/ask spread are assured.
  2. Trend Tracking Indexes (TTIs)

Buy or Sell decisions for Domestic and International ETFs (section 1 and 2), are made based on the respective TTI and its position either above or below its long-term M/A (Moving Average). A crossing of the trend line from below accompanied by some staying power above constitutes a “Buy” signal. Conversely, a clear break below the line constitutes a “Sell” signal. Additionally, I use a 7.5% trailing stop loss on all positions in these categories to control downside risk.

  1. All other investment arenas do not have a TTI and should be traded based on the position of the individual ETF relative to its own respective trend line (%M/A). That’s why those signals are referred to as a “Selective Buy.” In other words, if an ETF crosses its own trendline to the upside, a “Buy” signal is generated. Since these areas tend to be more volatile, I recommend a wider trailing sell stop of 7.5% -10% depending on your risk tolerance.

If you are unfamiliar with some of the terminology, please see Glossary of Terms and new subscriber information in section 9.


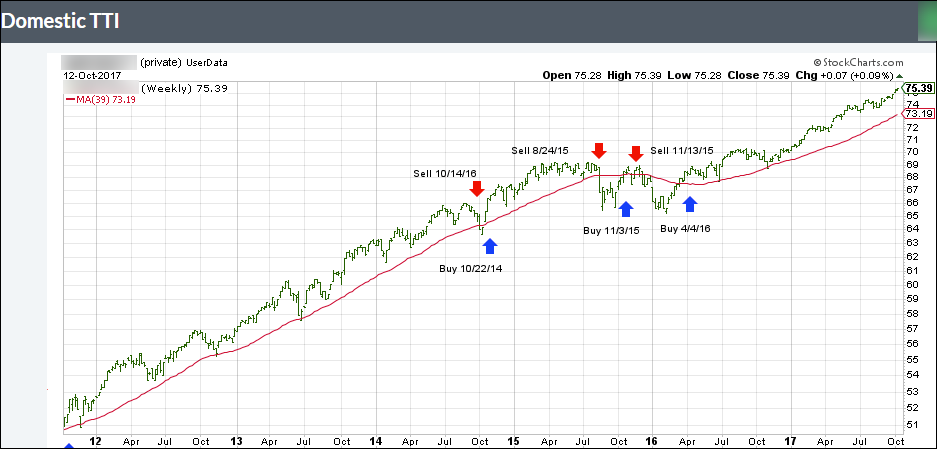
  1. DOMESTIC EQUITY ETFs: BUY — since 4/4/2016

Click on chart to enlarge

Our main directional indicator, the Domestic Trend Tracking Index (TTI-green line in the above chart) is positioned above its long-term trend line (red) by +3.60% after having generated a new Domestic Buy signal effective 4/4/2016 as posted.

Read More

Tech Slumps And Gold Pumps

Ulli Market Commentary Contact

[Chart courtesy of MarketWatch.com]
  1. Moving the Markets

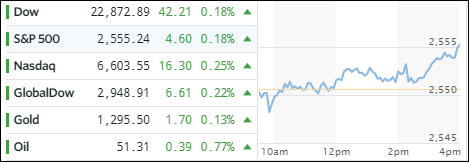
Despite another roller coaster ride, the Dow was the only one of the three major indexes that not only “survived” the mid-day sell-off but also registered another record high. The tech arena was not so lucky and, after a tremendous run in the recent past, had to accept the fact that nothing goes up forever. As a result, Apple dropped nearly 2% and the FANG stocks as a group simply puked with Google and Netflix losing the most and Facebook performing the best.

Not helping matters was the VIX spiking above 11 after hitting all-time lows yesterday. It’s too early to tell if that was just a dead cat bounce or the canary in the coalmine warning of more volatility to come. To be clear, the direction of the stock market is entirely dependent on volatility. Higher volatility translates to a bearish scenario while a lower VIX translates to a bullish environment. Some have cast their votes already, and one of them is well known hedge fund manager Jeff Gundlach who bought some S&P puts 5 months out, which will generate a nice return assuming a correction takes place within that time period.

Across asset classes, gold was the winner sporting a +0.79% gain while the Transportation (IYT) index got slammed at the tune of -3.10%. Financials joined the party with IYF dropping -0.50%; retailers (XRT) bucked the trend and added +1.45%. The yield on the 10-year bond spiked 3 basis points to close at 2.32%, and the US dollar (UUP) recovered some of yesterday’s sharp losses by adding +0.37%.

Read More