ETFs On The Cutline – Updated Through 08/04/2017

Ulli ETFs on the Cutline Contact

Below please find the latest High Volume ETFs Cutline report, which shows how far above or below their respective long-term trend lines (39 week SMA) my currently tracked ETFs are positioned.

This report covers the HV ETF Master List from Thursday’s StatSheet and includes 366 High Volume ETFs ETFs, defined as those with an average daily volume of more than $5 million, of which currently 281 (last week 287) are hovering in bullish territory. The yellow line separates those ETFs that are positioned above their trend line (%M/A) from those that have dropped below it.

Take a look:

The HV ETF Master Cutline Report            

In case you are not familiar with some of the terminology used in the reports, please read the Glossary of Terms.

If you missed the original post about the Cutline approach, you can read it here.

ETF Tracker Newsletter For August 4, 2017

Ulli ETF Tracker Contact

ETF Tracker StatSheet

https://theetfbully.com/2017/08/weekly-statsheet-etf-tracker-newsletter-updated-08032017/

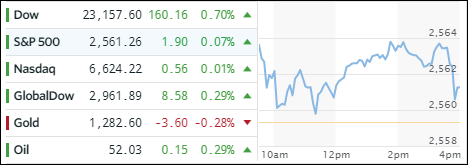
JOBS NUMBERS BETTER THAN EXPECTED

[Chart courtesy of MarketWatch.com]
  1. Moving the Markets

Again, bouncing around in a tight range was the theme of the day, but the major indexes managed to close in the green with the Dow ending at a record for the 8th straight day. The main supporting actor was not only the headline report of 209k jobs being added vs. an expected 180k, but also June’s revision higher to 231k from 222k. The month of May, however, was revised lower from 152k to 145k.

Under the hood, when looking at the quality of jobs, not much has changed from the prior months; the sector adding the most was the “waiters and bartenders” category with +53,000, its highest monthly increase since March 2014. It remains the strongest sector for US employment. As ZH reports, ‘there have now been 89 consecutive months without a decline for waiter and bartender jobs.’ Hardly a sign of a healthy and growing economy…

On the other hand, to heck with reality, all that matters is the perception that the economy is growing. Consequently, bonds dropped with the 10-year yield rising 3 basis points to settle at 2.27%. Gold got pushed down, as the Dollar Index (UUP) did its best imitation of a dead cat bounce intra-day, traded in a wide range but faded into the close with a gain of +0.87%.

Despite the tight trading range, all of our holdings closed higher, led by Transportations (IYT) with +0.77%. This was closely followed by SmallCaps (SCHA), which added +0.45% on the day.

Read More

Weekly StatSheet For The ETF Tracker Newsletter – Updated Through 08/03/2017

Ulli ETF StatSheet Contact

ETF Data updated through Thursday, August 3, 2017

Methodology/Use of this StatSheet:

  1. From the universe of over 1,800 ETFs, I have selected only those with a trading volume of over $5 million per day (HV ETFs), so that liquidity and a small bid/ask spread are assured.
  2. Trend Tracking Indexes (TTIs)

Buy or Sell decisions for Domestic and International ETFs (section 1 and 2), are made based on the respective TTI and its position either above or below its long-term M/A (Moving Average). A crossing of the trend line from below accompanied by some staying power above constitutes a “Buy” signal. Conversely, a clear break below the line constitutes a “Sell” signal. Additionally, I use a 7.5% trailing stop loss on all positions in these categories to control downside risk.

  1. All other investment arenas do not have a TTI and should be traded based on the position of the individual ETF relative to its own respective trend line (%M/A). That’s why those signals are referred to as a “Selective Buy.” In other words, if an ETF crosses its own trendline to the upside, a “Buy” signal is generated. Since these areas tend to be more volatile, I recommend a wider trailing sell stop of 7.5% -10% depending on your risk tolerance.

If you are unfamiliar with some of the terminology, please see Glossary of Terms and new subscriber information in section 9.


  1. DOMESTIC EQUITY ETFs: BUY — since 4/4/2016

Click on chart to enlarge

Our main directional indicator, the Domestic Trend Tracking Index (TTI-green line in the above chart) is positioned above its long-term trend line (red) by +3.16% after having generated a new Domestic Buy signal effective 4/4/2016 as posted.

Read More

Dow Squeezes Out Another Record; Energy Slumps

Ulli Market Commentary Contact

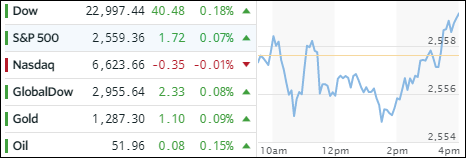
[Chart courtesy of MarketWatch.com]
  1. Moving the Markets

The broader market, weighed down by a slumping energy sector (-1.43%), simply could not keep up with the Dow, which notched its seventh consecutive all-time high, although by only the slightest of margins. Not helping the bulls was the fact that the US services economy presented a mixed picture as one component (PMI) came in at a 6-month high, while the other one (ISM) collapsed to 11-month lows. So you decide if this was good or bad…

Crude Oil took another hit but the Transportation Index (IYT) showed signs of life and rebounded +0.41%. Aerospace and Defense (ITA) joined in and gained +0.73%. Across the equity ETF spectrum, only the Dividend ETF (SCHD) managed to close in the green by adding +0.17%. SmallCaps (SCHA) not only lost -0.37% but also dropped below their 50-day M/A, which, when compared to the Dow makes sense in that SmallCaps get most of their revenues from domestic operations as opposed to a handful of Dow names generating most of their monies overseas.

This diversion of the Dow outperforming the rest of the market, especially with Transports having headed south over the past few weeks, could be the first sign of a slowing uptrend. The second one being weakness in SmallCaps as we enter the seasonally fragile August/September period.

Interest rates tumbled allowing the 20-bond (TLT) to score a nice gain of +1.03%. The US Dollar index (UUP) knee jerked and closed down losing another -0.25%.

Read More

Dow Pumps And Dollar Dumps

Ulli Market Commentary Contact

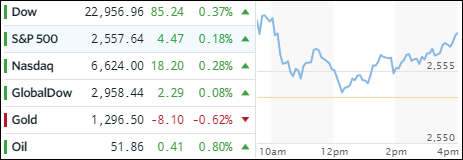
[Chart courtesy of MarketWatch.com]
  1. Moving the Markets

Thanks to an assist from Apple’s (AAPL) almost 5% gain on blow-out earnings, the Dow managed to conquer the much anticipated 22,000 level for the first time, which makes it its third 1,000-point milestone of the year. The close above 22k was the seventh fastest milestone move, with the last one having occurred in March (21k). The other credit goes to Boeing with its 53% YTD gain, which made it the best performer in the index.

Other news were not exactly awe inspiring with ADP’s weaker than expected jobs data, as manufacturing lost the most jobs since the election. Then there were escalating tensions with Russia, and China and India engaged in the latest face-off.

While there was quite some exuberance in Apple shares, most stocks were drifting with SmallCaps (SCHA) sinking -0.94% followed by MidCaps (SCHM) with -0.49%. The Transportation Average (IYT) managed to buck the trend with +0.28% and the Aerospace and Defense ETF (ITA) added +0.53%. Other than that, the overriding theme was “listless” with the S&P 500 not having gained 1% or more in a single day for 69 straight sessions, the longest streak since March 2007, according to ZH.

Interest rates rose with the yield on the 10-year bond inching up 1 basis point to 2.31%. The US dollar (UUP) had an interesting day in that it tested a new 27-month low but managed to rebound to a loss of only -0.12%.

Read More

Dow Moves Within Striking Distance Of 22,000

Ulli Market Commentary Contact

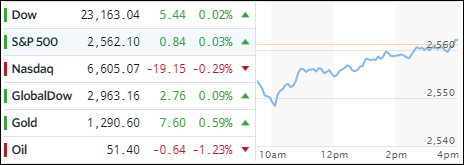
[Chart courtesy of MarketWatch.com]
  1. Moving the Markets

The theme of the “new normal” continued as less than glowing reports on inflation, manufacturing and collapsing ‘hard’ economic data, were brushed aside with the major indexes continuing their march into record territory. The Dow has now climbed to within striking distance of the 22,000 milestone marker.

Crude oil slipped -1.89% joined by the Transportation index (IYT) with -0.85% continuing its southerly path after having peaked the beginning of July. Semiconductors (SMH) added +0.43% while International Equities (SCHF) outperformed with a gain of +0.49%, matched by the Aerospace and Defense ETF (ITA). Those 2 were closely followed by Emerging Markets (SCHE) sporting +0.38%.

Interest rates fell, after dismal car sales, with the yield of the 10-year bond dropping 4 basis points to 2.26%, allowing the 20-year bond to rally +0.48% after having been stuck in a sideways pattern for the past week. Despite the US Dollar (UUP) rebounding, Gold pushed higher (above $1,280) and has now reached a level last seen when the Fed hiked rates. In other words, Gold’s losses caused in part by a rise in interest rates have been made up.

Read More