
- Moving the Markets
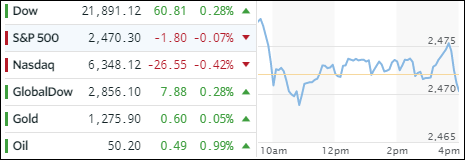
It was an uneventful last day of the month in the markets with the major indexes being content to more or less hug their respective unchanged lines with only the Dow pushing back into the green by a slight margin. For the month, the S&P 500 added +1.94% while the Nasdaq surged 3.5%.
The Dow notched its 5th record close in a row… thanks to Boeing. According to ZH, on the month, Boeing accounted for 310 of the Dow’s 570 point gain, which makes it more or less a one man show. Looking at some other favorites, the FANG stocks, despite some volatility, had their best month since October 2015 by gaining 10%. Here too, the main contributor was Netflix adding +22%.
The yield on the widely followed 10-year bond remained unchanged for the day but whipsawed throughout July. Crude oil danced to its own music and, after 4 straight down months, managed to score a 7% gain. Heading down into the basement best describes the action of the US dollar (UUP), which slid another -0.41% and is now honing in on the lows of 2016. The beneficiary of that slippage was gold, which had its best month since February and closing at its highest point since October 2016.
- ETFs in the Spotlight (updated for 2017)
In case you missed the announcement and description of this section, you can read it here again.
It features 10 broadly diversified and sector ETFs from my HighVolume list as posted every Saturday. Furthermore, they are screened for the lowest MaxDD% number meaning they have been showing better resistance to temporary sell offs than all others over the past year.
The below table simply demonstrates the magnitude with which some of the ETFs are fluctuating in regards to their positions above or below their respective individual trend lines (%M/A). A break below, represented by a negative number, shows weakness, while a break above, represented by a positive percentage, shows strength.
For hundreds of ETF choices, be sure to reference Thursday’s StatSheet.
Year to date, here’s how the 2017 candidates have fared so far:
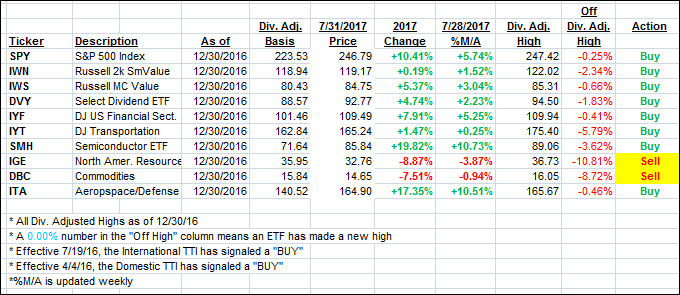
Again, the %M/A column above shows the position of the various ETFs in relation to their respective long term trend lines, while the trailing sell stops are being tracked in the “Off High” column. The “Action” column will signal a “Sell” once the -7.5% point has been taken out in the “Off High” column.
- Trend Tracking Indexes (TTIs)
Our Trend Tracking Indexes (TTIs) were mixed as the major indexes closed out the month being stuck at their respective e unchanged lines.
Here’s how we closed 7/31/2017:
Domestic TTI: +3.18% (last close +3.29%)—Buy signal effective 4/4/2016
International TTI: +8.07% (last close +8.06%)—Buy signal effective 7/19/2016
Disclosure: I am obliged to inform you that I, as well as my advisory clients, own some of the ETFs listed in the above table. Furthermore, they do not represent a specific investment recommendation for you, they merely show which ETFs from the universe I track are falling within the guidelines specified.
Contact Ulli