- Moving the Markets
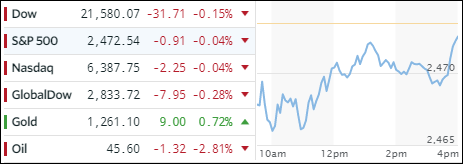
It was a nip and tuck kind of day with a rise in bond yields keeping any equity advances in check as hope prevailed that its impact on stocks would be ephemeral. The yield on the 10-year bond rose 2 basis points to 2.26% after having declined from a recent high of 2.39% set in early July.
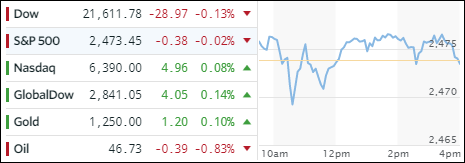
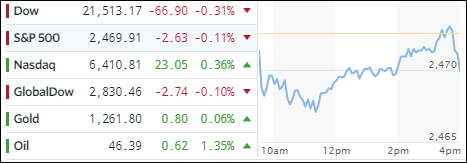
The Nasdaq managed to shake off broad market uncertainty and finished the session in record territory by adding +0.36%. All eyes remain on upcoming earnings with nearly 200 S&P 500 companies being scheduled to show their report card this week.
Across all markets, it was a quiet day. The transportation index (IYT) headed south again as the VIX crashed to a new record closing low confirming total complacency in investor sentiment. The retail sector slipped with XRT losing -1.49%, but the financials (XLF) managed to eke out a gain of +0.36%. Both, the US dollar and gold, meandered all day but went nowhere.
The Fed is scheduled to begin its 2-day meeting on interest rates tomorrow but, while no change in rates is expected, the linguistic experts on Wall Street will surely dissect the Wednesday statement for any clues as to when the Fed intents to reduce its $4.5 trillion balance sheet.