Bulls And Bears Engage In A Tug-Of-War

Ulli Market Commentary Contact

[Chart courtesy of MarketWatch.com]
  1. Moving the markets

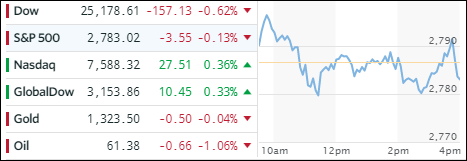
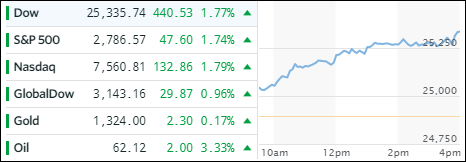
After Friday’s monster rally, and last week’s overall bullish tone in the markets, it comes as no surprise that the major averages might take a pause, and that’s precisely what happened. All three of them vacillated around the unchanged line with the Dow and S&P giving back a fraction while the Nasdaq closed in the green.

There was nothing on the economic calendar to assist the bulls or the bears, so the focus remained on Friday’s jobs report alleviating fears that solid growth might trigger wage pressure due to a tighter labor market. While this has not happened yet does not mean it won’t in the future, but for the time being Wall Street sees this as dampener to an acceleration in future interest rate hikes.

As a result, the 10-year bond yield slipped 3 basis points to 2.87%, however, rates and inflation will be a big risk factor going forward, and it remains to be seen where the bond trigger point will be that will eventually affect equity prices negatively.
Read More

ETFs On The Cutline – Updated Through 03/09/2018

Ulli Uncategorized Contact

Below please find the latest High Volume ETFs Cutline report, which shows how far above or below their respective long-term trend lines (39 week SMA) my currently tracked ETFs are positioned.

This report covers the HV ETF Master List from Thursday’s StatSheet and includes 366 High Volume ETFs ETFs, defined as those with an average daily volume of more than $5 million, of which currently 221 (last week 185) are hovering in bullish territory. The yellow line separates those ETFs that are positioned above their trend line (%M/A) from those that have dropped below it.

Take a look:

The HV ETF Master Cutline Report

In case you are not familiar with some of the terminology used in the reports, please read the Glossary of Terms.

If you missed the original post about the Cutline approach, you can read it here.

ETF Tracker Newsletter For March 9, 2018

Ulli ETF Tracker Contact

ETF Tracker StatSheet

https://theetfbully.com/2018/03/weekly-statsheet-etf-tracker-newsletter-updated-03-08-2018/

 A ONE WAY STREET FOR THE BULLS

[Chart courtesy of MarketWatch.com]
  1. Moving the markets

Forget the concerns of the past week. Things like tariffs, trade wars, rising bond yields and Gary Cohn’s exit from the White House appear to be in the rear view mirror, as the non-farm payroll report took front and center, which ZH summarized as follows:

While the headline payroll print of 313K was impressive, a look under the cover reveals even stronger data: first, the Household Survey showed that a whopping 785K jobs were added in February, while the number of unemployed Americans rose by only 22K, and with the labor force rising by 806K, this explains why the unemployment rate remained unchanged at 4.1%.

But what is even more notable is that when looking at the breakdown of job additions, one finds that in February, a near record 729K full-time jobs were added, the biggest monthly increase since last September’s 794K…

The bulls licked their chops and upward momentum went into overdrive despite the fly in the ointment being a total lack of wage growth, but hey, who cares about such trivia as the major indexes rallied without a pause with the Dow reclaiming its 25k level. The Wall Street mood was upbeat and remained that way despite the 10-year bond yield adding 4 basis points to end the week at 2.90%.

Notwithstanding the ups and downs all week, the US Dollar managed to close unchanged over the past 5 trading sessions. Looking towards next week, I am curious to see if this rally has legs and can lead us towards taking out the old highs.

Read More

Weekly StatSheet For The ETF Tracker Newsletter – Updated Through 03/08/2018

Ulli ETF StatSheet Contact

ETF Data updated through Thursday, March 8, 2018

Methodology/Use of this StatSheet:

  1. From the universe of over 1,800 ETFs, I have selected only those with a trading volume of over $5 million per day (HV ETFs), so that liquidity and a small bid/ask spread are assured.
  2. Trend Tracking Indexes (TTIs)

Buy or Sell decisions for Domestic and International ETFs (section 1 and 2), are made based on the respective TTI and its position either above or below its long-term M/A (Moving Average). A crossing of the trend line from below accompanied by some staying power above constitutes a “Buy” signal. Conversely, a clear break below the line constitutes a “Sell” signal. Additionally, I use a 7.5% trailing stop loss on all positions in these categories to control downside risk.

  1. All other investment arenas do not have a TTI and should be traded based on the position of the individual ETF relative to its own respective trend line (%M/A). That’s why those signals are referred to as a “Selective Buy.” In other words, if an ETF crosses its own trendline to the upside, a “Buy” signal is generated. Since these areas tend to be more volatile, I recommend a wider trailing sell stop of 7.5% -10% depending on your risk tolerance.

If you are unfamiliar with some of the terminology, please see Glossary of Terms and new subscriber information in section 9.


  1. DOMESTIC EQUITY ETFs: BUY — since 4/4/2016

Click on chart to enlarge

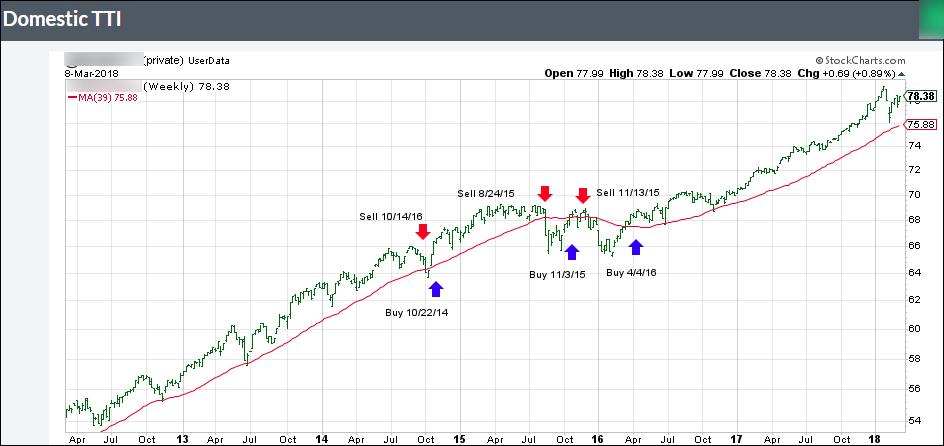
Our main directional indicator, the Domestic Trend Tracking Index (TTI-green line in the above chart) is positioned above its long-term trend line (red) by +3.46% after having generated a new Domestic Buy signal effective 4/4/2016 as posted.

Read More

Equities Drop and Pop

Ulli Market Commentary Contact

[Chart courtesy of MarketWatch.com]
  1. Moving the markets

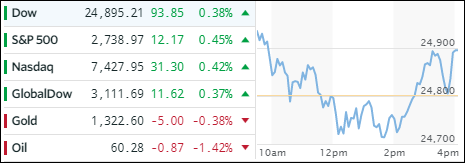
While we opened the session on a positive note, equities started slipping and sliding being spooked by early rumors as to who would get Gary Cohn’s job. However, that talk fell by the wayside when news headlines announced not only unlimited exemptions for Canada and Mexico from Trump’s tariffs but also allowed other countries (to be named later) to negotiate exclusions.

That shifted the early downtrend in reverse, and the major indexes crawled out of the basement and back above their respective trend lines to close modestly in the green. Leading our selected ETFs were LargeCaps (SCHX +0.43%) followed by International SmallCaps (SCHC +0.41%) and International Equities (SCHF +0.24%).

Interest rates slipped but came off their lows with the 10-year yield dropping 3 basis points to close at 2.86%. The US Dollar (UUP) rallied nicely, then fell back but still managed to gain +0.64%. Today looked to be one of consolidation and examination as to how the dreaded trade tariff threats may play out. If they indeed turn out to be “softer” than originally announced, meaning that just about any country can individually negotiate their own deal, we might see the rebound in equities become not just less volatile but also pick up some steam.

Read More

Overnight Futures Carnage; Markets Recover And Wipe Out Losses

Ulli Market Commentary Contact

[Chart courtesy of MarketWatch.com]
  1. Moving the markets

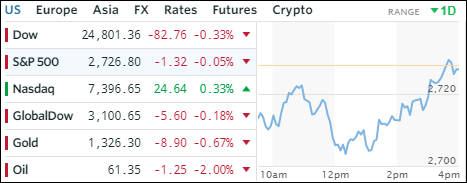
The futures markets looked downright ugly last night with Dow being down over 400 points, as the fallout from Wall Street-friendly Gary Cohn’s resignation made headlines around the world. The weakness spread into today’s session early on, but by mid-day a slow and steady crawl back materialized with the Nasdaq gaining, the Dow losing slightly while the S&P 500 got stuck just below its unchanged line.

The adverse market reaction was in regards to the upcoming tariffs on steel and aluminum imports, which Cohn had vehemently opposed and, with his resignation, fears of a trade war intensified. Neutralizing those negatives was the release of the Fed’s beige book, which surprisingly highlighted modest economic growth along with moderate inflation. That was music in the ears of the bulls and the rebound began.

With the markets bouncing as rapidly as they did today, the recovery only had a limited effect on our selected ETFs. The gainers were Semiconductors (SMH +0.43%), Aerospace & Defense (ITA +0.30%), MidCaps (SCHM +0.20%) and Emerging Markets (SCHE +0.14%).

Interest rates swung wildly but settled down at the end with the 10-year bond yield adding 1 basis point to close at 2.89. The US Dollar showed some gains early on, but slipped to give back a tiny -0.09%. I expect more volatility as the “tough trade talk” continues, yet any talk of compromise is sure to set the markets on fire.

Read More