
- Moving the markets
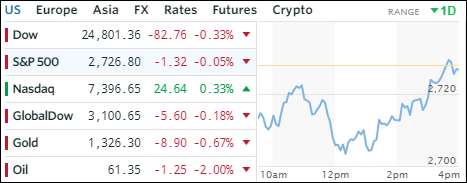
The futures markets looked downright ugly last night with Dow being down over 400 points, as the fallout from Wall Street-friendly Gary Cohn’s resignation made headlines around the world. The weakness spread into today’s session early on, but by mid-day a slow and steady crawl back materialized with the Nasdaq gaining, the Dow losing slightly while the S&P 500 got stuck just below its unchanged line.
The adverse market reaction was in regards to the upcoming tariffs on steel and aluminum imports, which Cohn had vehemently opposed and, with his resignation, fears of a trade war intensified. Neutralizing those negatives was the release of the Fed’s beige book, which surprisingly highlighted modest economic growth along with moderate inflation. That was music in the ears of the bulls and the rebound began.
With the markets bouncing as rapidly as they did today, the recovery only had a limited effect on our selected ETFs. The gainers were Semiconductors (SMH +0.43%), Aerospace & Defense (ITA +0.30%), MidCaps (SCHM +0.20%) and Emerging Markets (SCHE +0.14%).
Interest rates swung wildly but settled down at the end with the 10-year bond yield adding 1 basis point to close at 2.89. The US Dollar showed some gains early on, but slipped to give back a tiny -0.09%. I expect more volatility as the “tough trade talk” continues, yet any talk of compromise is sure to set the markets on fire.
- ETFs in the Spotlight
In case you missed the announcement and description of this section, you can read it here again.
It features 10 broadly diversified and sector ETFs from my HighVolume list as posted every Saturday. Furthermore, they are screened for the lowest MaxDD% number meaning they have been showing better resistance to temporary sell offs than all others over the past year.
The below table simply demonstrates the magnitude with which some of the ETFs are fluctuating in regards to their positions above or below their respective individual trend lines (%M/A). A break below, represented by a negative number, shows weakness, while a break above, represented by a positive percentage, shows strength.
For hundreds of ETF choices, be sure to reference Thursday’s StatSheet.
Year to date, here’s how our candidates have fared so far:
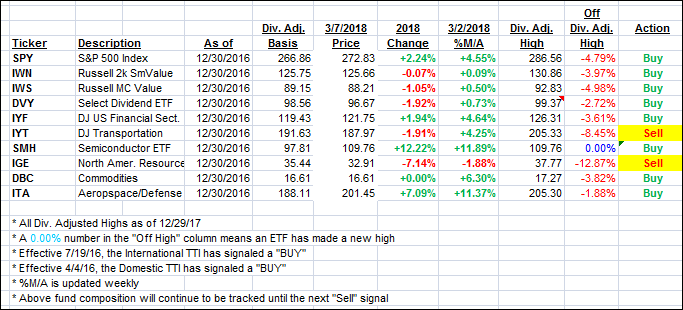
Again, the %M/A column above shows the position of the various ETFs in relation to their respective long term trend lines, while the trailing sell stops are being tracked in the “Off High” column. The “Action” column will signal a “Sell” once the -7.5% point has been taken out in the “Off High” column.
- Trend Tracking Indexes (TTIs)
Our Trend Tracking Indexes (TTIs) inched higher as the markets recovered from an early sell-off.
Here’s how we closed 3/07/2018:
Domestic TTI: +3.25% above its M/A (last close +3.18%)—Buy signal effective 4/4/2016
International TTI: +2.96% above its M/A (last close +2.81%)—Buy signal effective 7/19/2016
Disclosure: I am obliged to inform you that I, as well as my advisory clients, own some of the ETFs listed in the above table. Furthermore, they do not represent a specific investment recommendation for you, they merely show which ETFs from the universe I track are falling within the guidelines specified.
Contact Ulli