Markets Resemble A Bucking Bronco

Ulli Market Commentary Contact

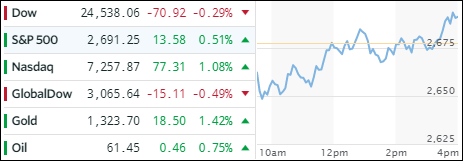
[Chart courtesy of MarketWatch.com]
  1. Moving the markets

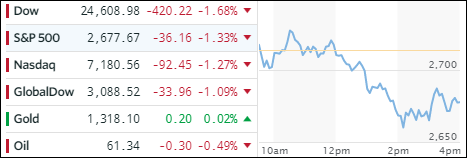
The S&P 500 chart clearly demonstrates the kind of trading session we saw today with wild swings in the averages, below and above their respective trend lines, resembling a bucking bronco. In the end, the bulls notched a victory and scored modest gains.

There were only two news items which created this wild market behavior. First, there were positive developments between North and South Korea agreeing to hold their first summit in April, after more than 10 years of silence. Second, the tariff hype game found some opposition in the Republican Party, but Trump appeared to show some willingness to be flexible on trade tariffs with Canada and Mexico. But, any clarity is still missing making me believe that markets will continue with their erratic reactions to the latest headline ping pong.

Nevertheless, the bulls prevailed, and our selected ETFs ended up in the green. With the Nasdaq outperforming on the day, it’s no surprise that Semiconductors (SMH) lead the pack with +1.47%. International SmallCaps (SCHC +0.99%) and International Equities (SCHF +0.77%) took second and third place respectively. Aerospace & Defense (ITA) lagged with -0.17%.

Despite the volatility in equities, interest rates were tame with the 10-year bond yield remaining unchanged at 2.88%. The US Dollar (UUP) headed back south by -0.26% giving back some of its recently earned gains.
Read More

Snapping The Losing Streak

Ulli Market Commentary Contact

[Chart courtesy of MarketWatch.com]
  1. Moving the markets

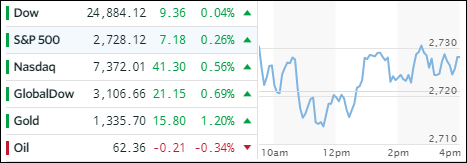
After last week’s drubbing, and an early morning pullback, the major indexes managed a broad-based bounce back with Wall Street traders looking past the trade war rhetoric by focusing on economic data and hope that the sell-off was overdone. Even political uncertainty in Italian elections, where a populist anti-euro party made a better-than-expected showing, couldn’t stop the bulls from flexing their muscles.

Supporting the rally was bargain hunting and short covering with news out of Washington clearly controlling market direction. Sure, we may see more growth and robust earnings, but at the same time we may also have to confront ongoing volatility, caused by hawkish comments and higher rates, which could bring in the downside at anytime.

However, for today it was bullishness across the board with our selected ETFs faring well. Financials (XLF) were the dominator by adding a solid +1.41%. That was followed by the Dividend ETF (DVY +1.22%), MidCaps (SCHM +1.21%) and LargeCaps (SCHX +1.12%).

Interest rates bounced intra-day with the 10-year bond yield adding 2 basis points to close the session at 2.88%. The US Dollar (UUP) vacillated but ended unchanged remaining a tad below its 50-day M/A.

Read More

ETFs On The Cutline – Updated Through 03/02/2018

Ulli ETFs on the Cutline Contact

Below please find the latest High Volume ETFs Cutline report, which shows how far above or below their respective long-term trend lines (39 week SMA) my currently tracked ETFs are positioned.

This report covers the HV ETF Master List from Thursday’s StatSheet and includes 366 High Volume ETFs ETFs, defined as those with an average daily volume of more than $5 million, of which currently 185 (last week 219) are hovering in bullish territory. The yellow line separates those ETFs that are positioned above their trend line (%M/A) from those that have dropped below it.

Take a look:

The HV ETF Master Cutline Report

In case you are not familiar with some of the terminology used in the reports, please read the Glossary of Terms.

If you missed the original post about the Cutline approach, you can read it here.

ETF Tracker Newsletter For March 2, 2018

Ulli ETF StatSheet Contact

ETF Tracker StatSheet

https://theetfbully.com/2018/03/weekly-statsheet-etf-tracker-newsletter-updated-03-01-2018/

 SQUEEZING THE SHORTS SAVES THE DAY

[Chart courtesy of MarketWatch.com]
  1. Moving the markets

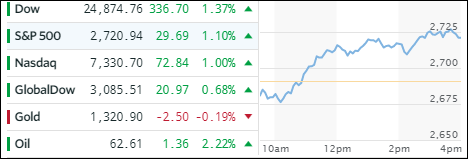
The session started out with another downside hit, but ended with a slow but steady crawl higher and above the unchanged line with only the Dow lagging to register its 4th day in a row closing in the red. The culprit, accounting for a 50-point bite out of the Dow, was McDonald’s loss of -4.8% its biggest one-day percentage drop since October 2008.

As is usually the case, extreme market moves to either side can be overdone, as was the case this week. In the end, we saw the shorts being massively squeezed, which had to cover and contributed to today’s rebound, along with a sudden overriding view that the reaction to the tariff announcements was probably overdone.

Markets around the world were hard hit with especially Germany’s DAX tumbling some 13% in the last few weeks, almost 6% this week, since a large part of their economy is export-driven. Be that as it may, tariffs are not a good thing, despite Trump’s assertion that they “are good and easy to win.” Yet most investors are unaware of the consequences. In 2002, President Bush imposed 30% steel tariffs; you can read here what happened next and why the tariffs were reversed.

The 10-year bond yield jumped 5 basis points today to close at 2.86%, but thanks to slipping earlier in the week they ended the past 5 sessions 2 basis points lower. Also helping the market recover was a spanking of the VIX, which was pushed down from a high of 26 to 19. Despite slipping -0.42% today, the US Dollar ended the week higher for the 4th of the last 5 weeks.

So far, no damage was done to our current holdings in regards to their trailing sell stops, and we’ll have to wait and see how this tariff tantrum plays out next week.

Read More

Weekly StatSheet For The ETF Tracker Newsletter – Updated Through 03/01/2018

Ulli ETF StatSheet Contact

ETF Data updated through Thursday, March 1, 2018

Methodology/Use of this StatSheet:

  1. From the universe of over 1,800 ETFs, I have selected only those with a trading volume of over $5 million per day (HV ETFs), so that liquidity and a small bid/ask spread are assured.
  2. Trend Tracking Indexes (TTIs)

Buy or Sell decisions for Domestic and International ETFs (section 1 and 2), are made based on the respective TTI and its position either above or below its long-term M/A (Moving Average). A crossing of the trend line from below accompanied by some staying power above constitutes a “Buy” signal. Conversely, a clear break below the line constitutes a “Sell” signal. Additionally, I use a 7.5% trailing stop loss on all positions in these categories to control downside risk.

  1. All other investment arenas do not have a TTI and should be traded based on the position of the individual ETF relative to its own respective trend line (%M/A). That’s why those signals are referred to as a “Selective Buy.” In other words, if an ETF crosses its own trendline to the upside, a “Buy” signal is generated. Since these areas tend to be more volatile, I recommend a wider trailing sell stop of 7.5% -10% depending on your risk tolerance.

If you are unfamiliar with some of the terminology, please see Glossary of Terms and new subscriber information in section 9.


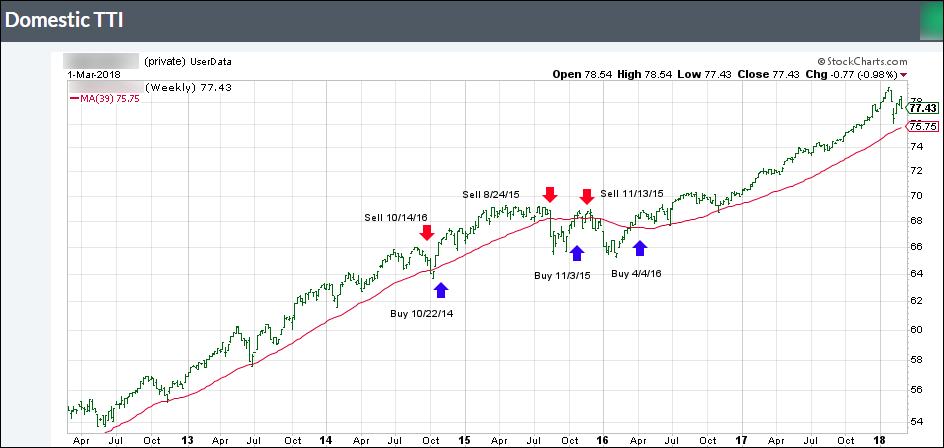
  1. DOMESTIC EQUITY ETFs: BUY — since 4/4/2016

Click on chart to enlarge

Our main directional indicator, the Domestic Trend Tracking Index (TTI-green line in the above chart) is positioned above its long-term trend line (red) by +2.33% after having generated a new Domestic Buy signal effective 4/4/2016 as posted.

Read More

Trifecta Of Events Sends Markets Into Tailspin

Ulli Market Commentary Contact

[Chart courtesy of MarketWatch.com]
  1. Moving the markets

For the third day in a row, the major indexes got spanked again notching their worst decline in some three weeks as a trifecta of events combined to give the bears the upper hand.

First, there was Fed chair Powell, who has left the markets guessing how he feels about inflationary pressures by pronouncing on his second day on Capitol Hill that “we don’t want to fall behind the curve on inflation,” which was interpreted as hawkish.

Second, Fed governor Dudley joined the hawkish talk by educating the uninformed that 4 rate hikes in 2018 should be still considered ‘gradual.’

Third, President Trump added insult to an already weakening market and delivered the knock-out punch by announcing that he would impose tariffs on steel (25%) and aluminum (10%) imports adding to concerns about upcoming trade wars hurting corporations and consumers. That’s all it took to spook any remaining bulls as stocks, bond yields and the US Dollar headed south.

The 10-year bond yield gave back 6 basis points to close at 2.81%, while the US Dollar (UUP) lost -0.34%, and the major indexes each gave back in excess of 1%. Our Trend Tracking Indexes (TTIs), section 3 below, remain bullish and none of our trailing sell stops were triggered during today’s drubbing.

Read More