
- Moving the markets
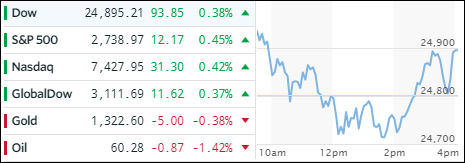
While we opened the session on a positive note, equities started slipping and sliding being spooked by early rumors as to who would get Gary Cohn’s job. However, that talk fell by the wayside when news headlines announced not only unlimited exemptions for Canada and Mexico from Trump’s tariffs but also allowed other countries (to be named later) to negotiate exclusions.
That shifted the early downtrend in reverse, and the major indexes crawled out of the basement and back above their respective trend lines to close modestly in the green. Leading our selected ETFs were LargeCaps (SCHX +0.43%) followed by International SmallCaps (SCHC +0.41%) and International Equities (SCHF +0.24%).
Interest rates slipped but came off their lows with the 10-year yield dropping 3 basis points to close at 2.86%. The US Dollar (UUP) rallied nicely, then fell back but still managed to gain +0.64%. Today looked to be one of consolidation and examination as to how the dreaded trade tariff threats may play out. If they indeed turn out to be “softer” than originally announced, meaning that just about any country can individually negotiate their own deal, we might see the rebound in equities become not just less volatile but also pick up some steam.
- ETFs in the Spotlight
In case you missed the announcement and description of this section, you can read it here again.
It features 10 broadly diversified and sector ETFs from my HighVolume list as posted every Saturday. Furthermore, they are screened for the lowest MaxDD% number meaning they have been showing better resistance to temporary sell offs than all others over the past year.
The below table simply demonstrates the magnitude with which some of the ETFs are fluctuating in regards to their positions above or below their respective individual trend lines (%M/A). A break below, represented by a negative number, shows weakness, while a break above, represented by a positive percentage, shows strength.
For hundreds of ETF choices, be sure to reference Thursday’s StatSheet.
Year to date, here’s how our candidates have fared so far:
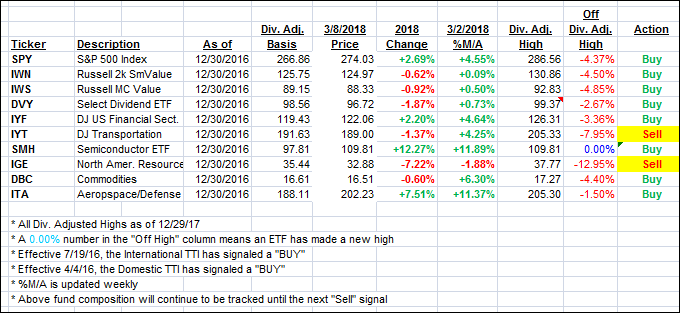
Again, the %M/A column above shows the position of the various ETFs in relation to their respective long term trend lines, while the trailing sell stops are being tracked in the “Off High” column. The “Action” column will signal a “Sell” once the -7.5% point has been taken out in the “Off High” column.
- Trend Tracking Indexes (TTIs)
Our Trend Tracking Indexes (TTIs) edged higher in a repeat performance of yesterday.
Here’s how we closed 3/08/2018:
Domestic TTI: +3.46% above its M/A (last close +3.25%)—Buy signal effective 4/4/2016
International TTI: +3.32% above its M/A (last close +2.96%)—Buy signal effective 7/19/2016
Disclosure: I am obliged to inform you that I, as well as my advisory clients, own some of the ETFs listed in the above table. Furthermore, they do not represent a specific investment recommendation for you, they merely show which ETFs from the universe I track are falling within the guidelines specified.
Contact Ulli