ETF Tracker Newsletter For January 12, 2018

Ulli ETF Tracker Contact

ETF Tracker StatSheet

https://theetfbully.com/2018/01/weekly-statsheet-etf-tracker-newsletter-updated-01-11-2018/

MORE RECORDS IN THE BOOKS

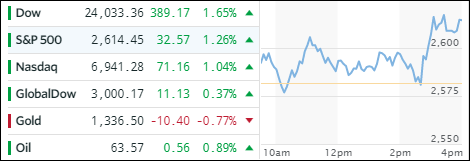
[Chart courtesy of MarketWatch.com]
  1. Moving the markets

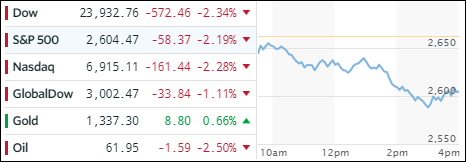
Earnings season unofficially started with a bang, as the major indexes continued their march into uncharted territory with optimism about the upcoming corporate report cards taking center stage. All 3 major indexes spiked again with consumer discretionary and energy shares leading the gains. Looking at the big picture, the S&P 500 had its best start to a year since 1987, while the Dow and Nasdaq had their best start since 1997 and 2004 respectively.

Things looked good in the ETF space I follow with green being the favorite color of the week. Leadership rotated from yesterday with Aerospace & Defense (ITA) gaining +1.54% followed by International SmallCaps (SCHC +1.22%) and International ETFs (SCHF +0.91%). The laggard of the day turned out to be MidCaps (SCHM) with +0.33%.

Interest rates presented a mixed picture with 10-year bond yield rising by 1 basis point, while the 30-year bond yield declined 6 basis points. Gold surged today and has now rallied for 5 straight weeks. Crude Oil bounced higher and the US Dollar (UUP) got spanked hard, gapped down and lost -1.04% to reach a level last seen in September when it made its 2017 low.

Read More

Weekly StatSheet For The ETF Tracker Newsletter – Updated Through 01/11/2018

Ulli ETF StatSheet Contact

ETF Data updated through Thursday, January 11, 2018

Methodology/Use of this StatSheet:

  1. From the universe of over 1,800 ETFs, I have selected only those with a trading volume of over $5 million per day (HV ETFs), so that liquidity and a small bid/ask spread are assured.
  2. Trend Tracking Indexes (TTIs)

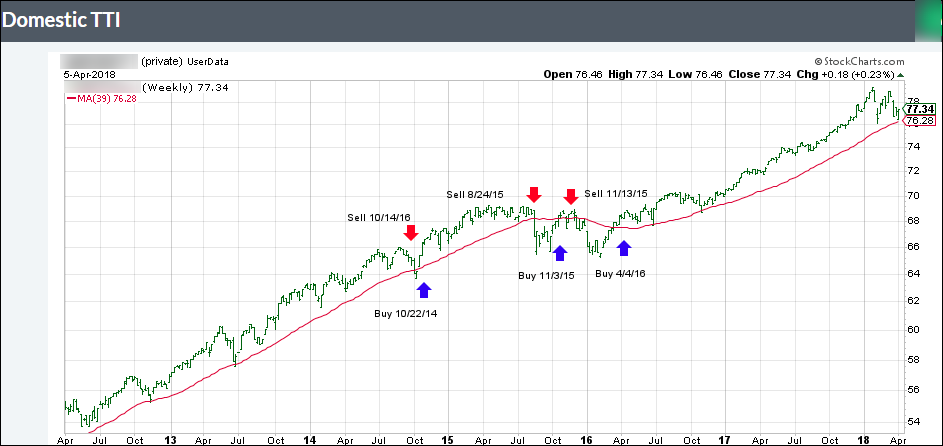
Buy or Sell decisions for Domestic and International ETFs (section 1 and 2), are made based on the respective TTI and its position either above or below its long-term M/A (Moving Average). A crossing of the trend line from below accompanied by some staying power above constitutes a “Buy” signal. Conversely, a clear break below the line constitutes a “Sell” signal. Additionally, I use a 7.5% trailing stop loss on all positions in these categories to control downside risk.

  1. All other investment arenas do not have a TTI and should be traded based on the position of the individual ETF relative to its own respective trend line (%M/A). That’s why those signals are referred to as a “Selective Buy.” In other words, if an ETF crosses its own trendline to the upside, a “Buy” signal is generated. Since these areas tend to be more volatile, I recommend a wider trailing sell stop of 7.5% -10% depending on your risk tolerance.

If you are unfamiliar with some of the terminology, please see Glossary of Terms and new subscriber information in section 9.


  1. DOMESTIC EQUITY ETFs: BUY — since 4/4/2016

Click on chart to enlarge

Our main directional indicator, the Domestic Trend Tracking Index (TTI-green line in the above chart) is positioned above its long-term trend line (red) by +4.78% after having generated a new Domestic Buy signal effective 4/4/2016 as posted.

Read More

Anticipation Of Good Earning Catapults The Major Indexes

Ulli Market Commentary Contact

[Chart courtesy of MarketWatch.com]
  1. Moving the markets

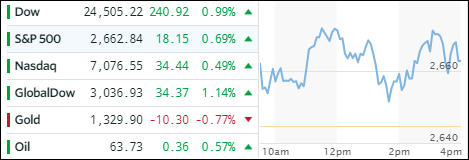
Yesterday’s worries about China’s lack of interest in purchasing US Treasuries are now a thing of the past while other concerns, such as jobless claims and wholesale inflation data, were simply ignored in anticipation of a hopefully great earnings season, which is expected to be the catalyst to drive the markets to new highs.

So, up we went right after the opening bell, never looked back, and the major indexes, actually accelerated into the close setting new all-time highs across the board. Yes, even the YTD lagging SmallCaps participated. Surprisingly, all this happened with the VIX rising and testing the 10 level.

Showing strong leadership in our ETF space were Transportations (IYT) with an impressive +2.37% gain, which made it not only its 8th up day in a row but also its best start to a year since 2001. Taking second and third place were SmallCaps (SCHA +1.62%) and MidCaps (SCHM +1.14%). Lagging the bunch were Semiconductors (SMH) with +0.47%.

Treasury yields reversed from their recent rally with the 10-year yield giving back 1 basis point to 2.54%, while the 30-year auction attracted a lot of interest contributing to the lower yield scenario. The US Dollar (UUP) was not so lucky and plunged -0.42% and is now in danger of taking out the lows made earlier this year.

Read More

Logging The First Down Day Of The Year

Ulli Market Commentary Contact

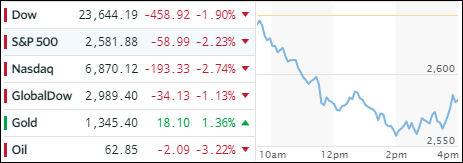
[Chart courtesy of MarketWatch.com]
  1. Moving the markets

I had to happen eventually and today was the day. The major indexes actually traded below the unchanged line all day, staged a comeback but ended slightly in the red, as some profit taking set in. Caution prevailed as yesterday’s bond slam-fest remained on traders’ minds. The cause of jumping bond yields were reports out of China that they are considering “slowing or halting” purchases of U.S. debt, an event that would definitely accelerate a rise in yields.

With the markets going nowhere, that theme carried over to the ETF space as well, where losers outnumbered gainers. Actually, the only ETFs in our stable of holdings ending in the green were Financials (XLF +0.84%) and Transportations (IYT +0.10%). All others retreated led by the winner YTD, namely Semiconductors (SMH -1.32%), followed by Emerging Markets (SCHE -0.48%) and MidCaps (SCHM -0.35%).

Intra-day, the yield of the 10-year bond climbed another 4 basis points before backing up and ending unchanged at 2.55%. The more interest rate sensitive high-yield arena (HYG) suffered for the second day in a row and closed lower by -0.22%. The US Dollar (UUP) slumped after 3 days straight of gains and lost -0.25%.

Read More

Dow Continues Record Setting Pace; Bonds Get Clobbered

Ulli Market Commentary Contact

[Chart courtesy of MarketWatch.com]
  1. Moving the markets

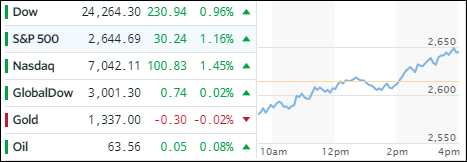
Thanks to Boeing, which added more than 60 points to the Dow, the index set another record while the S&P 500 and Nasdaq gained for the 6th straight day. There was no particular driver for the advance other than continued market optimism.

In our ETF space, winners outpaced losers by a small margin. Financials (XLF) added +0.78%, thanks to the surge in interest rates, with Aerospace & Defense (ITA +0.64%) taking second place. On the downside, Semiconductors (SMH) struggled and gave back -0.94% followed by SmallCaps (SCHA) with -0.10%.

Things were not so calm in bond land, as the 10-year yield jumped 6 basis points to close at +2.55%, which is the highest yield since December of 2016, shortly after Trump’s election. That did not bode well for the 20-year bond ETF (TLT), which gapped down and dove -1.34% to reach a level last seen in the middle of last December. Interest rates will be key to the continuation of the bull market in equities, with a danger point lurking once the 3% level (10-year bond yield) gets broken to the upside.

Read More

A Big Day For The Bulls

Ulli Market Commentary Contact

[Chart courtesy of MarketWatch.com]
  1. Moving the markets

This is the time of the year when market historians come out and use the first five trading days of the year to compare it to the past and then project the results out for the remainder of 2018. Today was no different, and these are the results as translated by ZH:

Thanks to today’s gains, the S&P 500 is up 2.5% – doubling the gains in gold – as bonds are suffering so far…which means, as Ryan Detrick notes, “since 1950, when the first 5 days are up over 2%, the S&P 500 is higher for the year 15 out of 15 times with an average return of +18.6%. “

Unless, of course, this time is different!

Be that as it may, two of the three major indexes eked out another gain while the Dow struggled and fell short reaching the unchanged line. In ETF space, we saw predominantly gains with only International SmallCaps (SCHC -0.13%), Financials (XLF -0.14%) and International Equities (SCHF -0.06%) surrendering a fraction of a percent. On the positive side, Transportations (IYT) led with +0.81%, followed by Semiconductors (SMH +0.69%) and Aerospace & Defense (ITA +0.60%).

The yield on the 10-year bond rose 2 basis points to 2.49%, its highest level since March 2017 and is now honing in on last year’s high. The US Dollar Index (UUP) showed signs of life by gaining +0.46%, its best bounce in 3 weeks.

Read More