
ETF Tracker StatSheet
https://theetfbully.com/2018/01/weekly-statsheet-etf-tracker-newsletter-updated-01-11-2018/
MORE RECORDS IN THE BOOKS
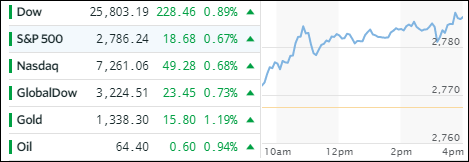
- Moving the markets
Earnings season unofficially started with a bang, as the major indexes continued their march into uncharted territory with optimism about the upcoming corporate report cards taking center stage. All 3 major indexes spiked again with consumer discretionary and energy shares leading the gains. Looking at the big picture, the S&P 500 had its best start to a year since 1987, while the Dow and Nasdaq had their best start since 1997 and 2004 respectively.
Things looked good in the ETF space I follow with green being the favorite color of the week. Leadership rotated from yesterday with Aerospace & Defense (ITA) gaining +1.54% followed by International SmallCaps (SCHC +1.22%) and International ETFs (SCHF +0.91%). The laggard of the day turned out to be MidCaps (SCHM) with +0.33%.
Interest rates presented a mixed picture with 10-year bond yield rising by 1 basis point, while the 30-year bond yield declined 6 basis points. Gold surged today and has now rallied for 5 straight weeks. Crude Oil bounced higher and the US Dollar (UUP) got spanked hard, gapped down and lost -1.04% to reach a level last seen in September when it made its 2017 low.
- ETFs in the Spotlight
In case you missed the announcement and description of this section, you can read it here again.
It features 10 broadly diversified and sector ETFs from my HighVolume list as posted every Saturday. Furthermore, they are screened for the lowest MaxDD% number meaning they have been showing better resistance to temporary sell offs than all others over the past year.
The below table simply demonstrates the magnitude with which some of the ETFs are fluctuating in regards to their positions above or below their respective individual trend lines (%M/A). A break below, represented by a negative number, shows weakness, while a break above, represented by a positive percentage, shows strength.
For hundreds of ETF choices, be sure to reference Thursday’s StatSheet.
Year to date, here’s how our candidates have fared so far:
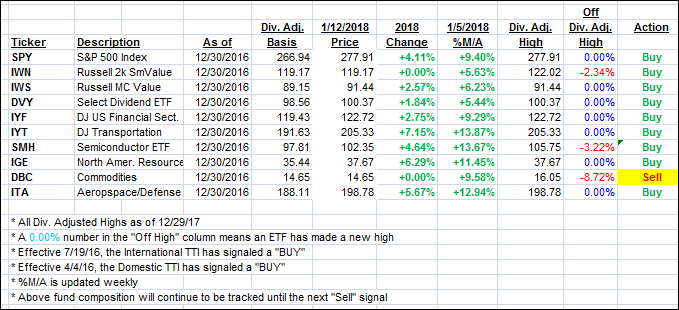
Again, the %M/A column above shows the position of the various ETFs in relation to their respective long term trend lines, while the trailing sell stops are being tracked in the “Off High” column. The “Action” column will signal a “Sell” once the -7.5% point has been taken out in the “Off High” column.
- Trend Tracking Indexes (TTIs)
Our Trend Tracking Indexes (TTIs) were mixed with the International one outperforming.
Here’s how we closed 1/12/2018:
Domestic TTI: +4.78% above its M/A (last close +4.78%)—Buy signal effective 4/4/2016
International TTI: +8.13% above its M/A (last close +7.67%)—Buy signal effective 7/19/2016
Disclosure: I am obliged to inform you that I, as well as my advisory clients, own some of the ETFs listed in the above table. Furthermore, they do not represent a specific investment recommendation for you, they merely show which ETFs from the universe I track are falling within the guidelines specified.
————————————————————-
READER Q & A FOR THE WEEK
All Reader Q & A’s are listed at our web site!
Check it out at:
https://theetfbully.com/questions-answers/
———————————————————-
WOULD YOU LIKE TO HAVE YOUR INVESTMENTS PROFESSIONALLY MANAGED?
Do you have the time to follow our investment plans yourself? If you are a busy professional who would like to have his portfolio managed using our methodology, please contact me directly or get more details at:
https://theetfbully.com/personal-investment-management/
———————————————————
Back issues of the ETF/No Load Fund Tracker are available on the web at:
https://theetfbully.com/newsletter-archives/
Contact Ulli