ETFs On The Cutline – Updated Through 03/29/2018

Ulli ETFs on the Cutline Contact

Below please find the latest High Volume ETFs Cutline report, which shows how far above or below their respective long-term trend lines (39 week SMA) my currently tracked ETFs are positioned.

This report covers the HV ETF Master List from Thursday’s StatSheet and includes 366 High Volume ETFs ETFs, defined as those with an average daily volume of more than $5 million, of which currently 173 (last week 109) are hovering in bullish territory. The yellow line separates those ETFs that are positioned above their trend line (%M/A) from those that have dropped below it.

Take a look:

The HV ETF Master Cutline Report

In case you are not familiar with some of the terminology used in the reports, please read the Glossary of Terms.

If you missed the original post about the Cutline approach, you can read it here.

Weekly StatSheet For The ETF Tracker Newsletter – Updated Through 03/29/2018

Ulli ETF StatSheet Contact

ETF Data updated through Thursday, March 29, 2018

Methodology/Use of this StatSheet:

  1. From the universe of over 1,800 ETFs, I have selected only those with a trading volume of over $5 million per day (HV ETFs), so that liquidity and a small bid/ask spread are assured.
  2. Trend Tracking Indexes (TTIs)

Buy or Sell decisions for Domestic and International ETFs (section 1 and 2), are made based on the respective TTI and its position either above or below its long-term M/A (Moving Average). A crossing of the trend line from below accompanied by some staying power above constitutes a “Buy” signal. Conversely, a clear break below the line constitutes a “Sell” signal. Additionally, I use a 7.5% trailing stop loss on all positions in these categories to control downside risk.

  1. All other investment arenas do not have a TTI and should be traded based on the position of the individual ETF relative to its own respective trend line (%M/A). That’s why those signals are referred to as a “Selective Buy.” In other words, if an ETF crosses its own trendline to the upside, a “Buy” signal is generated. Since these areas tend to be more volatile, I recommend a wider trailing sell stop of 7.5% -10% depending on your risk tolerance.

If you are unfamiliar with some of the terminology, please see Glossary of Terms and new subscriber information in section 9.


  1. DOMESTIC EQUITY ETFs: BUY — since 4/4/2016

Click on chart to enlarge

Our main directional indicator, the Domestic Trend Tracking Index (TTI-green line in the above chart) is positioned above its long-term trend line (red) by +1.28% after having generated a new Domestic Buy signal effective 4/4/2016 as posted.

Read More

A Broad Rally Ends A Poor Month

Ulli Market Commentary Contact

[Chart courtesy of MarketWatch.com]
  1. Moving the markets

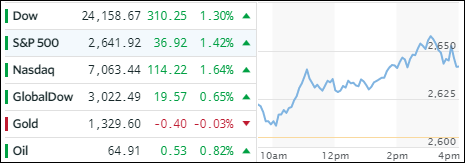
A solid and broad rally right after the opening bell pulled the major indexes out of the doldrums with the bulls finally managing to reduce some of the losses sustained not only in March but YTD as well. Today’s leaders were the dogs of the month, namely tech and energy.

We’ll have to wait and see if the recent spanking of company’s like Facebook, Tesla, Twitter and Amazon will fade into the background come April or will be brought back on the front burner. But there were other culprits as well that contributed to weakness in equities, and those issues are far from being over. Global trade war concerns and a new Fed chairman, not afraid to raise rates at an accelerated pace, combined to bring stock prices down from their euphoric levels reached in 2017 and may continue to do so.

In the end, volatility and investor confusion have reach new heights but nobody can actually accurately forecast how this next quarter will play out. That’s why I believe it’s best to stick with our Trend Tracking strategy, which allows us to keep our emotions in check by only following the direction of the major trend along with our trailing sell stops. These two indicators will serve as our guide to calmly make buy/sell decisions especially when the market heat is on. This prevents us from making irrational moves when the media’s “headline hockey” game reaches ridiculous levels.

Read More

Tech Leads Markets Lower In Choppy Session

Ulli Uncategorized Contact

[Chart courtesy of MarketWatch.com]
  1. Moving the markets

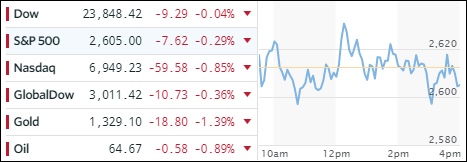
Choppy and sloppy best describes today’s session, as the major indexes vacillated around their respective unchanged lines with the Nasdaq showing the most weakness as tech shares continued their swoon. It was a tug-of-war between good economic growth data along with home sales on one side and the bearish forces still in play from the beaten up tech complex on the other side. In the end, the sagging tech sector won but only by a small margin.

One thing that seems to be sorely missing from the current market activity is the buy-the-dip phenomenon that we’ve been almost taken for granted over the past year. All of a sudden, sharp market corrections without much subsequent lasting buying have occurred. While last Friday’s market dump saw a recovery on Monday, it was short-lived, which almost puts us back to Friday’s level. It will be interesting to see of the widely watched S&P’s 200-day M/A will hold for the third time, come next week.  Any break below will surely invite more selling.

We may very well be close to an inflection point where the major trend could reverse and send us back into the bearish camp. Our Trend Tracking Indexes (TTIs) are both within striking distance of crossing below their long-term trend lines and confirm this viewpoint (see section 3 below).

With one more trading session to go in this Holiday shortened week, it remains to be seen if the bulls can gain the upper hand and recuperate some of March’s losses.

Read More

Tech Sector Imitates A Swan Dive

Ulli Uncategorized Contact

[Chart courtesy of MarketWatch.com]
  1. Moving the markets

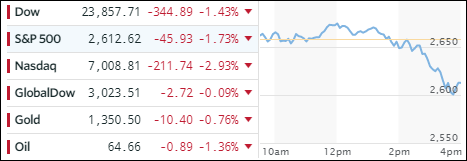
And it all started so peacefully. The markets opened on the plus side, after Monday’s euphoric rebound, when, after hugging the unchanged line for a while, the bottom suddenly dropped out, and the tech sector (-3.5%) did its best imitation of a swan dive pulling the entire equity arena with it. In the end, most of yesterday’s broad gains were given back.

Headlines engulfed the tech sector ranging from self-driving car issues, Tesla probe, Facebook hearings and reports that Google and Twitter may be pulled into the social media frenzy as well.

The S&P 500 tumbled -1.73% and is now again within striking distance of reaching its widely watched 200-day M/A, a break below of which might have dire consequences and could accelerate downside momentum.

As the VIX spiked, US banks got hammered after a nice showing yesterday. Commodities and Energy were hit hard. Bond yields tumbled with the 10-year giving back 7 basis points to 2.78%, its lowest since early February. The US Dollar (UUP) rebounded sharply overnight, pulled back and settled for a gain of +0.47%.

While none of our trailing sell stops were triggered, our Trend Tracking Indexes (TTI) slipped again closer to a potential “Sell” signal with especially the international one getting close. Please see the details in section 3 below.

Read More

Snap-Back Rally Propels Equities Higher

Ulli Market Commentary Contact

[Chart courtesy of MarketWatch.com]
  1. Moving the markets

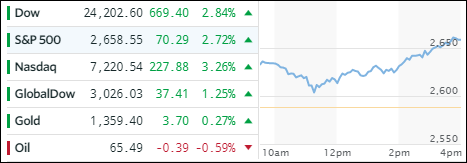
The much feared wave of selling that dominated last week came to a sudden end when the major indexes opened higher, pulled back slightly and then rocketed into the close thereby recording their largest one-day percentage gains since the middle of 2015. The bulls finally showed signs of life supported by reports that behind the scenes talks between the US and China, to avoid a global trade war, showed some promise.

Technically speaking, today’s rebound was a repeat of the one we saw on February 8 when the S&P 500 bounced off its 200-day M/A, which was exactly what happened today. So, today’s market action can be just as much attributed to technical factors as the trade talk rumors.

Nevertheless, today’s recovery wiped out just about half of the losses sustained last week. As I mentioned in Friday’s post, the “Sell” signal generated by the International TTI would be subject to this morning’s market behavior. This what I said:

Today’s action sent our Trend Tracking Indexes (TTIs) much lower (see section 3), and we have a split picture. While the Domestic one remains in bullish territory by +0.83%, the International one has breached its long-term trend line to the downside by -0.45%, which means a “Sell” signal for this arena has been generated and all broadly diversified international ETFs should be sold.

They way I do this in my advisor practice is that I will first observe the markets on Monday morning to see if a rebound is in the making. If there is, I will hold off with my liquidation plans. If the markets, however, show continued weakness, I will follow through and sell those ETFs that are affected.

Needless to say, the rebound was in the making, and I held off with my liquidations plans for the time being. They will be revisited once the TTI drops back below its long-term moving average.

Green was the dominant color of the day, and all of our current ETF holdings rallied to varying degrees. Heading the group were Semiconductors (SMH +3.98%), Emerging Markets (SCHE +3.24%) and Financials (XLF +3.24%).

Interest rates moved up with the 10-year bond yield gaining 3 basis points to 2.85%, while the US Dollar (UUP) took a dive and lost -0.47%.

While today’s rebound was certainly welcome after last week’s drubbing, it’s far from certain whether this is another dead cat bounce, that will come back down to test the S&P’s 200-day M/A again, or an attempt to take out the all-time highs. We have to be prepared to deal with either possibility where the latter requires no action on our part while the former might bring another “Sell” signal into play.

Read More