
- Moving the markets
This is the time of the year when market historians come out and use the first five trading days of the year to compare it to the past and then project the results out for the remainder of 2018. Today was no different, and these are the results as translated by ZH:
Thanks to today’s gains, the S&P 500 is up 2.5% – doubling the gains in gold – as bonds are suffering so far…which means, as Ryan Detrick notes, “since 1950, when the first 5 days are up over 2%, the S&P 500 is higher for the year 15 out of 15 times with an average return of +18.6%. “
Unless, of course, this time is different!
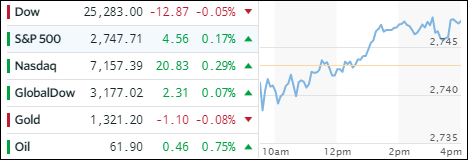
Be that as it may, two of the three major indexes eked out another gain while the Dow struggled and fell short reaching the unchanged line. In ETF space, we saw predominantly gains with only International SmallCaps (SCHC -0.13%), Financials (XLF -0.14%) and International Equities (SCHF -0.06%) surrendering a fraction of a percent. On the positive side, Transportations (IYT) led with +0.81%, followed by Semiconductors (SMH +0.69%) and Aerospace & Defense (ITA +0.60%).
The yield on the 10-year bond rose 2 basis points to 2.49%, its highest level since March 2017 and is now honing in on last year’s high. The US Dollar Index (UUP) showed signs of life by gaining +0.46%, its best bounce in 3 weeks.
- ETFs in the Spotlight
In case you missed the announcement and description of this section, you can read it here again.
It features 10 broadly diversified and sector ETFs from my HighVolume list as posted every Saturday. Furthermore, they are screened for the lowest MaxDD% number meaning they have been showing better resistance to temporary sell offs than all others over the past year.
The below table simply demonstrates the magnitude with which some of the ETFs are fluctuating in regards to their positions above or below their respective individual trend lines (%M/A). A break below, represented by a negative number, shows weakness, while a break above, represented by a positive percentage, shows strength.
For hundreds of ETF choices, be sure to reference Thursday’s StatSheet.
Year to date, here’s how our candidates have fared so far:
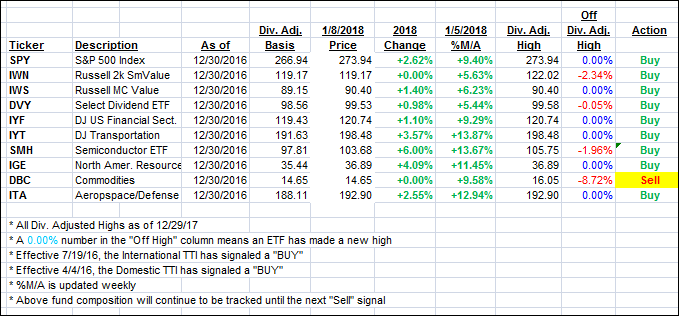
Again, the %M/A column above shows the position of the various ETFs in relation to their respective long term trend lines, while the trailing sell stops are being tracked in the “Off High” column. The “Action” column will signal a “Sell” once the -7.5% point has been taken out in the “Off High” column.
- Trend Tracking Indexes (TTIs)
Our Trend Tracking Indexes (TTIs) headed north with the bulls being firmly in control.
Here’s how we closed 1/8/2018:
Domestic TTI: +4.45% above its M/A (last close +4.37%)—Buy signal effective 4/4/2016
International TTI: +6.67% above its M/A (last close +6.71%)—Buy signal effective 7/19/2016
Disclosure: I am obliged to inform you that I, as well as my advisory clients, own some of the ETFs listed in the above table. Furthermore, they do not represent a specific investment recommendation for you, they merely show which ETFs from the universe I track are falling within the guidelines specified.
Contact Ulli