
- Moving the markets
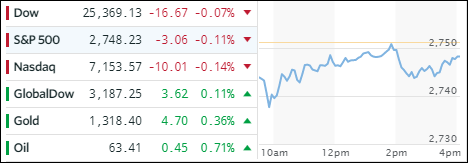
I had to happen eventually and today was the day. The major indexes actually traded below the unchanged line all day, staged a comeback but ended slightly in the red, as some profit taking set in. Caution prevailed as yesterday’s bond slam-fest remained on traders’ minds. The cause of jumping bond yields were reports out of China that they are considering “slowing or halting” purchases of U.S. debt, an event that would definitely accelerate a rise in yields.
With the markets going nowhere, that theme carried over to the ETF space as well, where losers outnumbered gainers. Actually, the only ETFs in our stable of holdings ending in the green were Financials (XLF +0.84%) and Transportations (IYT +0.10%). All others retreated led by the winner YTD, namely Semiconductors (SMH -1.32%), followed by Emerging Markets (SCHE -0.48%) and MidCaps (SCHM -0.35%).
Intra-day, the yield of the 10-year bond climbed another 4 basis points before backing up and ending unchanged at 2.55%. The more interest rate sensitive high-yield arena (HYG) suffered for the second day in a row and closed lower by -0.22%. The US Dollar (UUP) slumped after 3 days straight of gains and lost -0.25%.
- ETFs in the Spotlight
In case you missed the announcement and description of this section, you can read it here again.
It features 10 broadly diversified and sector ETFs from my HighVolume list as posted every Saturday. Furthermore, they are screened for the lowest MaxDD% number meaning they have been showing better resistance to temporary sell offs than all others over the past year.
The below table simply demonstrates the magnitude with which some of the ETFs are fluctuating in regards to their positions above or below their respective individual trend lines (%M/A). A break below, represented by a negative number, shows weakness, while a break above, represented by a positive percentage, shows strength.
For hundreds of ETF choices, be sure to reference Thursday’s StatSheet.
Year to date, here’s how our candidates have fared so far:
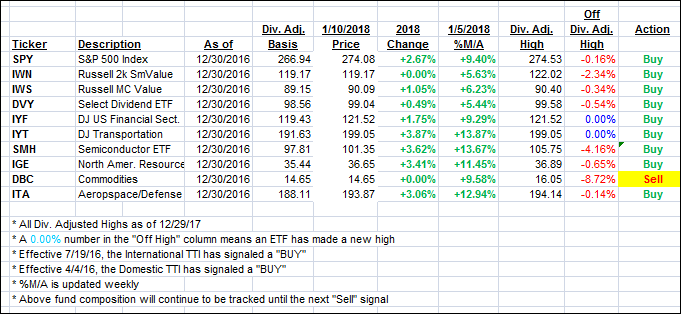
Again, the %M/A column above shows the position of the various ETFs in relation to their respective long term trend lines, while the trailing sell stops are being tracked in the “Off High” column. The “Action” column will signal a “Sell” once the -7.5% point has been taken out in the “Off High” column.
- Trend Tracking Indexes (TTIs)
Our Trend Tracking Indexes (TTIs) showed a mixed picture with the Domestic one dipping and the International gaining a tad.
Here’s how we closed 1/10/2018:
Domestic TTI: +4.47% above its M/A (last close +4.50%)—Buy signal effective 4/4/2016
International TTI: +7.04% above its M/A (last close +6.96%)—Buy signal effective 7/19/2016
Disclosure: I am obliged to inform you that I, as well as my advisory clients, own some of the ETFs listed in the above table. Furthermore, they do not represent a specific investment recommendation for you, they merely show which ETFs from the universe I track are falling within the guidelines specified.
Contact Ulli