
- Moving the markets
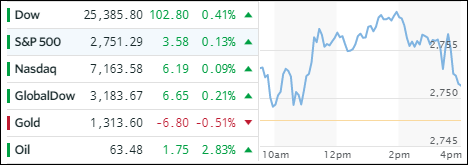
Thanks to Boeing, which added more than 60 points to the Dow, the index set another record while the S&P 500 and Nasdaq gained for the 6th straight day. There was no particular driver for the advance other than continued market optimism.
In our ETF space, winners outpaced losers by a small margin. Financials (XLF) added +0.78%, thanks to the surge in interest rates, with Aerospace & Defense (ITA +0.64%) taking second place. On the downside, Semiconductors (SMH) struggled and gave back -0.94% followed by SmallCaps (SCHA) with -0.10%.
Things were not so calm in bond land, as the 10-year yield jumped 6 basis points to close at +2.55%, which is the highest yield since December of 2016, shortly after Trump’s election. That did not bode well for the 20-year bond ETF (TLT), which gapped down and dove -1.34% to reach a level last seen in the middle of last December. Interest rates will be key to the continuation of the bull market in equities, with a danger point lurking once the 3% level (10-year bond yield) gets broken to the upside.
- ETFs in the Spotlight
In case you missed the announcement and description of this section, you can read it here again.
It features 10 broadly diversified and sector ETFs from my HighVolume list as posted every Saturday. Furthermore, they are screened for the lowest MaxDD% number meaning they have been showing better resistance to temporary sell offs than all others over the past year.
The below table simply demonstrates the magnitude with which some of the ETFs are fluctuating in regards to their positions above or below their respective individual trend lines (%M/A). A break below, represented by a negative number, shows weakness, while a break above, represented by a positive percentage, shows strength.
For hundreds of ETF choices, be sure to reference Thursday’s StatSheet.
Year to date, here’s how our candidates have fared so far:
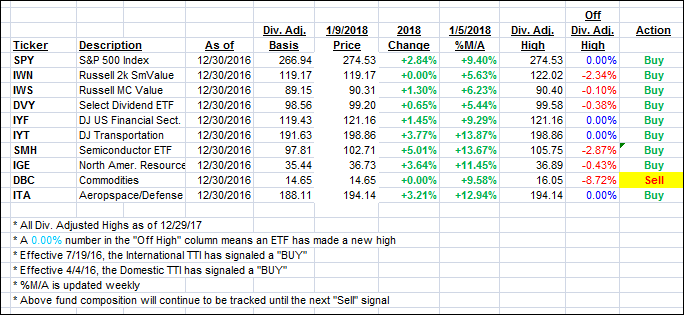
Again, the %M/A column above shows the position of the various ETFs in relation to their respective long term trend lines, while the trailing sell stops are being tracked in the “Off High” column. The “Action” column will signal a “Sell” once the -7.5% point has been taken out in the “Off High” column.
- Trend Tracking Indexes (TTIs)
Our Trend Tracking Indexes (TTIs) continued with their upward trajectory.
Here’s how we closed 1/9/2018:
Domestic TTI: +4.50% above its M/A (last close +4.45%)—Buy signal effective 4/4/2016
International TTI: +6.96% above its M/A (last close +6.67%)—Buy signal effective 7/19/2016
Disclosure: I am obliged to inform you that I, as well as my advisory clients, own some of the ETFs listed in the above table. Furthermore, they do not represent a specific investment recommendation for you, they merely show which ETFs from the universe I track are falling within the guidelines specified.
Contact Ulli