Due to a variety of business commitments, I won’t be able to write today’s market report. Regular posting will resume tomorrow afternoon.
Ulli…

Due to a variety of business commitments, I won’t be able to write today’s market report. Regular posting will resume tomorrow afternoon.
Ulli…
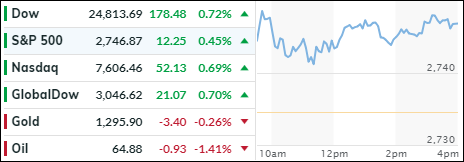
Markets behaved today as if a world of worry had simply disappeared. Still on a positive high from Friday’s jobs reports, upward momentum led to another green session for the major indexes. The main driver was the tech sector, which posted its first record close since the middle of March.
None of the weekend news seemed to matter, or were simply ignored, as trade talks between U.S. and China broke down, and a host of European finance ministers paraded around to express disappointment over Trump’s decision to burden the major allies with stiff tariffs.
Spiking interest rates did not matter as the 10-year bond yield jumped 5 basis points to close at 2.94%. Never mind that factory orders slumped -0.8% and had their worst April since 2012. While the March number was upwardly revised, year over year the growth trend slowed down.
Today was all about exposure to risk assets and focus on the upcoming Central Bank meeting next week, where a rate hike is pretty much a foregone conclusion. The main debate remains whether or not the Fed will hold off with a fourth increase this year.
Historically June is usually not a good month for equities. Over the past 2 decades, June has been the fourth-worst month of the year for the Dow and S&P 500. We’ll have to see if it’s different this time.
Below please find the latest High Volume ETFs Cutline report, which shows how far above or below their respective long-term trend lines (39 week SMA) my currently tracked ETFs are positioned.
This report covers the HV ETF Master List from Thursday’s StatSheet and includes 366 High Volume ETFs ETFs, defined as those with an average daily volume of more than $5 million, of which currently 168 (last week 168) are hovering in bullish territory. The yellow line separates those ETFs that are positioned above their trend line (%M/A) from those that have dropped below it.
Take a look:
The HV ETF Master Cutline Report
In case you are not familiar with some of the terminology used in the reports, please read the Glossary of Terms.
If you missed the original post about the Cutline approach, you can read it here.
ETF Tracker StatSheet
STILL STUCK IN ‘NO MAN’S LAND’
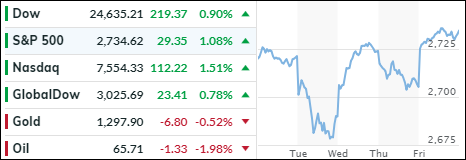
The above weekly chart demonstrates the 4-day roller coaster ride we just went through. While this clearly points to the ever present uncertainties, as perceived by the markets, the S&P 500 and the Nasdaq managed to close a tad higher, but the Dow lagged and closed lower at week’s end.
Throwing the big assist, after yesterday’s plunge, was a stronger-than-expected jobs report showing 223k new jobs created vs. 200k expected, while the unemployment rate fell to 3.8%, an 18-year low. Impressive was that gains were more broad based, and not just minimum wage, but also covering sectors such as Professional Services, Manufacturing, Education and Healthcare.
On the other hand, the numbers seem confusing and do not add up, as there are some 102 million Americans who are either unemployed or out of the labor force. Be that as it may, the markets did not care and the headline number simply ruled, giving the major indexes a chance to dig themselves out of yesterday’s hole.
While trade wars and concerns about Italian politics are still alive, some alleged progress was made last night, as the populist parties struck a deal to form a coalition government ending months of gridlock. That propelled the European markets and spilled over into the U.S. right after the opening bell.
The fact that markets tend to ignore realities, and prefer focusing on the headline du jour, is best illustrated by ZH’s summary:
In the end, while weakened during the roller-coaster ride, our Trend Tracking Indexes (TTIs) remain in bullish territory. Even the International one, which had come to within 0.02% of crossing into bear market territory, bounced off its trend line showing signs of a modest recovery.
I expect this type of wild ride to continue until some massive event appears that will push the markets out of its current trading range. The only question remains “will it be to the upside or to the downside?” We have to be prepared for either one.
In a way, Morgan Stanley is already prepping its clients for the next stock market crash using sophisticated technology and advising them to Hold On For Dear Life (HODL) at a time when bullishness is the prevailing theme not only on Wall Street but around most parts of the world as well.
ETF Data updated through Thursday, May 31, 2018

Methodology/Use of this StatSheet:
Buy or Sell decisions for Domestic and International ETFs (section 1 and 2), are made based on the respective TTI and its position either above or below its long-term M/A (Moving Average). A crossing of the trend line from below accompanied by some staying power above constitutes a “Buy” signal. Conversely, a clear break below the line constitutes a “Sell” signal. Additionally, I use a 7.5% trailing stop loss on all positions in these categories to control downside risk.
If you are unfamiliar with some of the terminology, please see Glossary of Terms and new subscriber information in section 9.
 Click on chart to enlarge
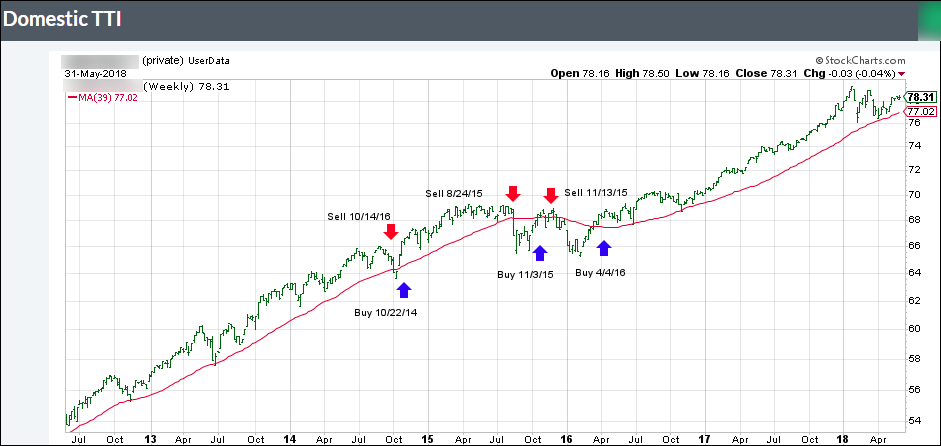
Our main directional indicator, the Domestic Trend Tracking Index (TTI-green line in the above chart) is positioned above its long-term trend line (red) by +1.81% after having generated a new Domestic Buy signal effective 4/4/2016 as posted.
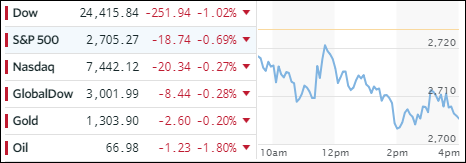
While worries about Italy’s politics faded for the moment, they were quickly replaced by news of a new Spanish PM, with a very critical view of the European Union, causing more uncertainties in the markets.
However, taking top billing was the Trump administration’s confirmation imposing steel and aluminum tariffs on the EU, Mexico and Canada beginning at midnight tonight. The response by the EU was quick and angry and counter balancing measures were said to be on its way.
Not helping the bearish mood were headlines that the housing rebound is slowly dying with new, existing and pending home sales tumbling in April.
As a result, the major indexes headed south again, after an encouraging rebound yesterday, but they managed to close in the green for the month with the S&P 500 adding 2.2%.
Despite sliding bond yields, with the 10-year dropping 1 basis point to close at 2.83%, we’ve seen as of late a variety of risk scenarios that have kept a lid on market advances.
Looking back to the beginning of the year, we’ve struggled with a range of issues, namely higher interest rates and inflation, which was followed by trade/geopolitical fears and now Italian and Spanish politics.
And, let’s not forget the potential downgrade and/or possible demise of Deutsche Bank (DB), AKA the mother of all derivatives. Making its situation even more critical was today’s disclosure by the Fed that DB had been placed on a “troubled condition” status a year ago. Ouch!
It promises to be an interesting summer…