
- Moving the markets
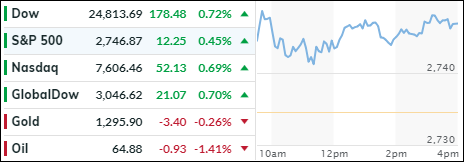
Markets behaved today as if a world of worry had simply disappeared. Still on a positive high from Friday’s jobs reports, upward momentum led to another green session for the major indexes. The main driver was the tech sector, which posted its first record close since the middle of March.
None of the weekend news seemed to matter, or were simply ignored, as trade talks between U.S. and China broke down, and a host of European finance ministers paraded around to express disappointment over Trump’s decision to burden the major allies with stiff tariffs.
Spiking interest rates did not matter as the 10-year bond yield jumped 5 basis points to close at 2.94%. Never mind that factory orders slumped -0.8% and had their worst April since 2012. While the March number was upwardly revised, year over year the growth trend slowed down.
Today was all about exposure to risk assets and focus on the upcoming Central Bank meeting next week, where a rate hike is pretty much a foregone conclusion. The main debate remains whether or not the Fed will hold off with a fourth increase this year.
Historically June is usually not a good month for equities. Over the past 2 decades, June has been the fourth-worst month of the year for the Dow and S&P 500. We’ll have to see if it’s different this time.
- ETFs in the Spotlight
In case you missed the announcement and description of this section, you can read it here again.
It features 10 broadly diversified and sector ETFs from my HighVolume list as posted every Saturday. Furthermore, they are screened for the lowest MaxDD% number meaning they have been showing better resistance to temporary sell offs than all others over the past year.
The below table simply demonstrates the magnitude with which some of the ETFs are fluctuating in regards to their positions above or below their respective individual trend lines (%M/A). A break below, represented by a negative number, shows weakness, while a break above, represented by a positive percentage, shows strength.
For hundreds of ETF choices, be sure to reference Thursday’s StatSheet.
Year to date, here’s how our candidates have fared so far:
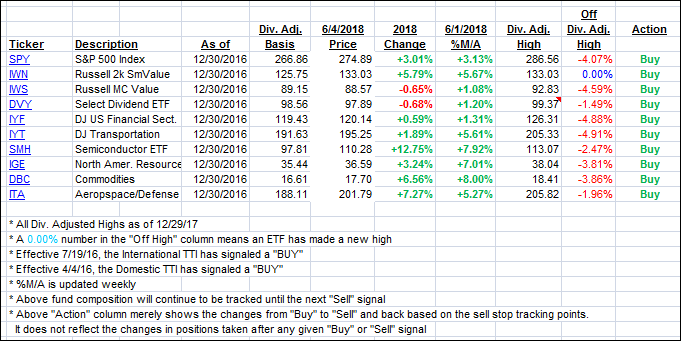
Again, the %M/A column above shows the position of the various ETFs in relation to their respective long term trend lines, while the trailing sell stops are being tracked in the “Off High” column. The “Action” column will signal a “Sell” once the -7.5% point has been taken out in the “Off High” column.
- Trend Tracking Indexes (TTIs)
Our Trend Tracking Indexes (TTIs) followed the major indexes higher.
Here’s how we closed 06/04/2018:
Domestic TTI: +2.34% above its M/A (last close +2.07%)—Buy signal effective 4/4/2016
International TTI: +1.44% below its M/A (last close +1.14%)—Buy signal effective 7/19/2016
Disclosure: I am obliged to inform you that I, as well as my advisory clients, own some of the ETFs listed in the above table. Furthermore, they do not represent a specific investment recommendation for you, they merely show which ETFs from the universe I track are falling within the guidelines specified.
Contact Ulli