
ETF Tracker StatSheet
STILL STUCK IN ‘NO MAN’S LAND’
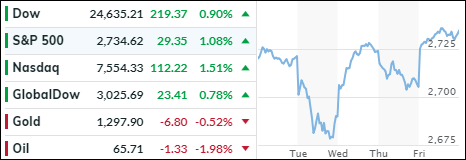
- Moving the markets
The above weekly chart demonstrates the 4-day roller coaster ride we just went through. While this clearly points to the ever present uncertainties, as perceived by the markets, the S&P 500 and the Nasdaq managed to close a tad higher, but the Dow lagged and closed lower at week’s end.
Throwing the big assist, after yesterday’s plunge, was a stronger-than-expected jobs report showing 223k new jobs created vs. 200k expected, while the unemployment rate fell to 3.8%, an 18-year low. Impressive was that gains were more broad based, and not just minimum wage, but also covering sectors such as Professional Services, Manufacturing, Education and Healthcare.
On the other hand, the numbers seem confusing and do not add up, as there are some 102 million Americans who are either unemployed or out of the labor force. Be that as it may, the markets did not care and the headline number simply ruled, giving the major indexes a chance to dig themselves out of yesterday’s hole.
While trade wars and concerns about Italian politics are still alive, some alleged progress was made last night, as the populist parties struck a deal to form a coalition government ending months of gridlock. That propelled the European markets and spilled over into the U.S. right after the opening bell.
The fact that markets tend to ignore realities, and prefer focusing on the headline du jour, is best illustrated by ZH’s summary:
- New anti-establishment Italian government? Check.
- New anti-establishment, socialist Spanish government? Check.
- Trade war between the US and Europe, Mexico, & Canada? Check.
- Deutsche Bank (most systemically risky bank in the world at one point) downgraded to a B-handle? Check.
- Fed Tightening as rate-hike odds rise after good jobs data trumps EU risk? Check.
In the end, while weakened during the roller-coaster ride, our Trend Tracking Indexes (TTIs) remain in bullish territory. Even the International one, which had come to within 0.02% of crossing into bear market territory, bounced off its trend line showing signs of a modest recovery.
I expect this type of wild ride to continue until some massive event appears that will push the markets out of its current trading range. The only question remains “will it be to the upside or to the downside?” We have to be prepared for either one.
In a way, Morgan Stanley is already prepping its clients for the next stock market crash using sophisticated technology and advising them to Hold On For Dear Life (HODL) at a time when bullishness is the prevailing theme not only on Wall Street but around most parts of the world as well.
- ETFs in the Spotlight
In case you missed the announcement and description of this section, you can read it here again.
It features 10 broadly diversified and sector ETFs from my HighVolume list as posted every Saturday. Furthermore, they are screened for the lowest MaxDD% number meaning they have been showing better resistance to temporary sell offs than all others over the past year.
The below table simply demonstrates the magnitude with which some of the ETFs are fluctuating in regards to their positions above or below their respective individual trend lines (%M/A). A break below, represented by a negative number, shows weakness, while a break above, represented by a positive percentage, shows strength.
For hundreds of ETF choices, be sure to reference Thursday’s StatSheet.
Year to date, here’s how our candidates have fared so far:
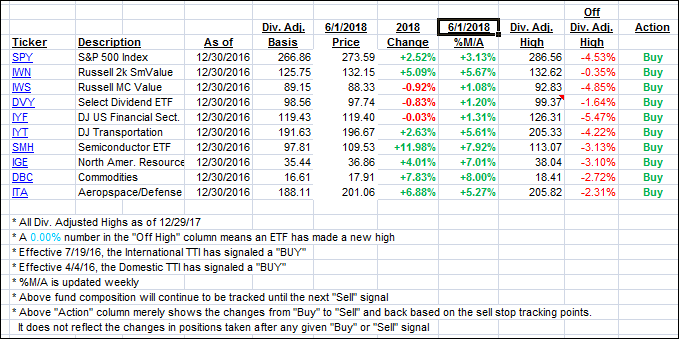
Again, the %M/A column above shows the position of the various ETFs in relation to their respective long term trend lines, while the trailing sell stops are being tracked in the “Off High” column. The “Action” column will signal a “Sell” once the -7.5% point has been taken out in the “Off High” column.
- Trend Tracking Indexes (TTIs)
Our Trend Tracking Indexes (TTIs) recovered as the positive jobs report ruled the headlines.
Here’s how we closed 06/01/2018:
Domestic TTI: +2.07% above its M/A (last close +1.81%)—Buy signal effective 4/4/2016
International TTI: +1.14% below its M/A (last close +0.46%)—Buy signal effective 7/19/2016
Disclosure: I am obliged to inform you that I, as well as my advisory clients, own some of the ETFs listed in the above table. Furthermore, they do not represent a specific investment recommendation for you, they merely show which ETFs from the universe I track are falling within the guidelines specified.
————————————————————-
READER Q & As
All Reader Q & A’s are listed at our web site!
Check it out at:
https://theetfbully.com/questions-answers/
———————————————————-
WOULD YOU LIKE TO HAVE YOUR INVESTMENTS PROFESSIONALLY MANAGED?
Do you have the time to follow our investment plans yourself? If you are a busy professional who would like to have his portfolio managed using our methodology, please contact me directly or get more details at:
https://theetfbully.com/personal-investment-management/
———————————————————
Back issues of the ETF/No Load Fund Tracker are available on the web at:
https://theetfbully.com/newsletter-archives/
Contact Ulli