ETFs On The Cutline – Updated Through 06/15/2018

Ulli ETFs on the Cutline Contact

Below please find the latest High Volume ETFs Cutline report, which shows how far above or below their respective long-term trend lines (39 week SMA) my currently tracked ETFs are positioned.

This report covers the HV ETF Master List from Thursday’s StatSheet and includes 366 High Volume ETFs ETFs, defined as those with an average daily volume of more than $5 million, of which currently 168 (last week 188) are hovering in bullish territory. The yellow line separates those ETFs that are positioned above their trend line (%M/A) from those that have dropped below it.

Take a look:

The HV ETF Master Cutline Report

In case you are not familiar with some of the terminology used in the reports, please read the Glossary of Terms.

If you missed the original post about the Cutline approach, you can read it here.

ETF Tracker Newsletter For June 15, 2018

Ulli ETF Tracker Contact

ETF Tracker StatSheet

https://theetfbully.com/2018/06/weekly-statsheet-for-the-etf-tracker-newsletter-updated-through-06-14-2018/

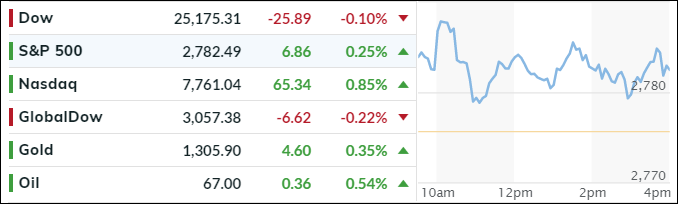
 A WILD WEEK, BUT S&P 500 ENDS UNCHANGED
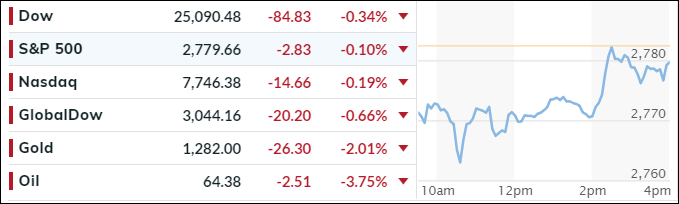
[Chart courtesy of MarketWatch.com]

It should come as no surprise that, based on the drubbing of the foreign currency markets, as I detailed yesterday, emerging market equities could not be far behind. That materialized today, as our emerging market ETF holding pierced its trailing sell stop and was liquidated in accordance with our sell stop discipline.

Domestically, the major indexes started in the red, as the U.S.-China trade dialog heated up with tensions escalating, but calmer heads prevailed on Wall Street, and a slow rebound ensued, which ended just short of the unchanged line.

It’s amazing that, despite the chaos not just in FX (Foreign Exchange) but also the debt and commodity arenas, the major indexes held up well with the S&P 500 closing just about even for the week, helped in part by the VIX getting crushed again.

The large banks lost, while the US Dollar had its highest weekly close since July 2017, which was exactly opposite of the Euro, which had its lowest weekly close since July 2017. Not looking too good either was the Commodity Index which, after a stellar YTD performance, was crushed this week. To me, that is just a temporary pullback since inflationary forces will continue to grow and affect the commodity sector positively.

Currently, I see two prevailing opinions regarding market direction. One is held by the smart money, represented in part by some well-known fund managers, who seem to have left equities, as this chart shows. On the other side are those, who are seeing a strong return of inflation and with it racing equity markets ending with a blow-off top sometime later this year.

Of course, along the way, there are a host of Black Swans lurking and waiting for the right moment to make an appearance. Since no one knows how this will end up playing out, we’ll continue to follow the major trends via our TTIs and execute our trailing sell stops when it becomes necessary.

Read More

Weekly StatSheet For The ETF Tracker Newsletter – Updated Through 06/14/2018

Ulli ETF StatSheet Contact

ETF Data updated through Thursday, June 14, 2018

Methodology/Use of this StatSheet:

  1. From the universe of over 1,800 ETFs, I have selected only those with a trading volume of over $5 million per day (HV ETFs), so that liquidity and a small bid/ask spread are assured.
  2. Trend Tracking Indexes (TTIs)

Buy or Sell decisions for Domestic and International ETFs (section 1 and 2), are made based on the respective TTI and its position either above or below its long-term M/A (Moving Average). A crossing of the trend line from below accompanied by some staying power above constitutes a “Buy” signal. Conversely, a clear break below the line constitutes a “Sell” signal. Additionally, I use a 7.5% trailing stop loss on all positions in these categories to control downside risk.

  1. All other investment arenas do not have a TTI and should be traded based on the position of the individual ETF relative to its own respective trend line (%M/A). That’s why those signals are referred to as a “Selective Buy.” In other words, if an ETF crosses its own trendline to the upside, a “Buy” signal is generated. Since these areas tend to be more volatile, I recommend a wider trailing sell stop of 7.5% -10% depending on your risk tolerance.

If you are unfamiliar with some of the terminology, please see Glossary of Terms and new subscriber information in section 9.


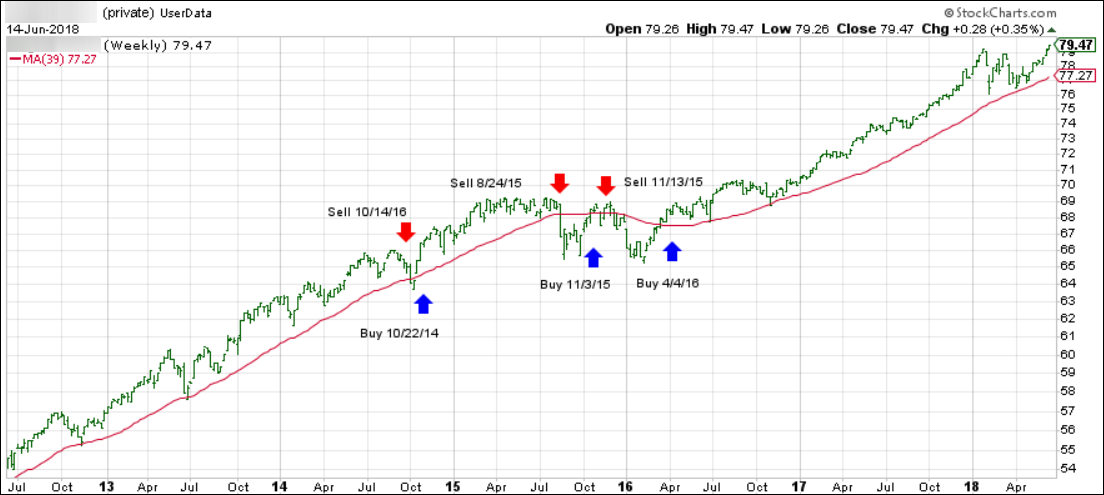
  1. DOMESTIC EQUITY ETFs: BUY — since 4/4/2016

Click on chart to enlarge

Our main directional indicator, the Domestic Trend Tracking Index (TTI-green line in the above chart) is positioned above its long-term trend line (red) by +3.01% after having generated a new Domestic Buy signal effective 4/4/2016 as posted.

Read More

Emerging Markets Dump While US Dollar Pumps

Ulli Market Commentary Contact

[Chart courtesy of MarketWatch.com]
  1. Moving the markets

If you only watched the major indexes meandering around their respective unchanged lines and closing slightly in the green, except for the Dow, you missed out on the real action in some of the emerging markets.

The headlines did not cover equities but the wild activity in the foreign exchange markets (FX). The Bloomberg US Dollar index erupted to an 8-month high with UUP gaining +1.30%, which was its second largest gain YTD resulting in a huge tumble of the Euro, which had its biggest daily drop since the Brexit vote.

Emerging Market exchange rates got crushed, despite promises of intervention and other rescue efforts. However, nothing worked. Take a look at these charts demonstrating the demolishing of the Mexican Peso, Brazilian Real, Turkish Lira and Argentine Peso. (Hat tip goes to ZH for these charts).

Yet, domestically, all appeared calm as tech stock outperformed financials. Bonds rallied as yields retreated, after touching the 3% level yesterday, with the 10-year dropping 4 basis points to end the session at 2.94%.

Leave it to ZH to sum up this crazy day perfectly: “US stocks are higher, because European stocks are higher, because Draghi crushed the Euro, because he sees growth ending…”

It all makes perfect sense now…

Read More

Hawkish Fed Puts The Break On Market Advances

Ulli Market Commentary Contact

[Chart courtesy of MarketWatch.com]
  1. Moving the markets

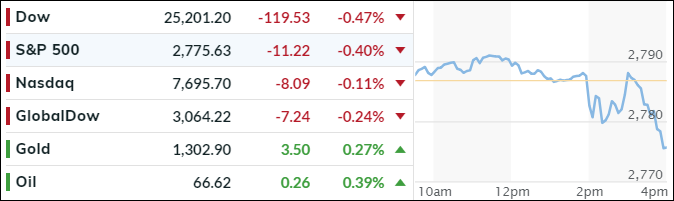
The major indexes hovered above the unchanged line for most of the session, but some volatility set in after the Fed’s (expected) announcement of a 25-bps increase in interest rates, while assuring the Wall Street crowd that the economy is not yet overheating. Yet, at the same time, Fed head Powell signaled that two more hikes would be on the table for 2018, rather than the expected hoped for one.

His exact words were “there is no sense in our forecasts that inflation will take off. If we thought inflation would take off, we would be showing higher rates.” You should feel much better now knowing that the CPI inflation you experience day-to-day, is non-existent.

In the end, equities dove into the close with the major indexes suffering mild losses. While the “most shorted stocks” were flat today, this chart demonstrates the tremendous impact of the short squeeze we’ve seen over the past few weeks.

As could be expected, bond yields rallied at first, with the 10-year yield touching the 3% level, before turning around and ending just about unchanged. The US Dollar rode his own roller coaster by heading higher at first, then dropping into the red, recovering into the green and closing below the unchanged line.

On the calendar for tomorrow is the widely anticipated ECB meeting, during which they are supposed to unveil the timing of their bond purchases. Translated, it simply means whether they will unwind at a faster or slower pace, the former of which translates to the equivalent of a tightening effect as far as monetary policy is concerned.

Read More

Treading Water Despite Surging Inflation

Ulli Market Commentary Contact

[Chart courtesy of MarketWatch.com]
  1. Moving the markets

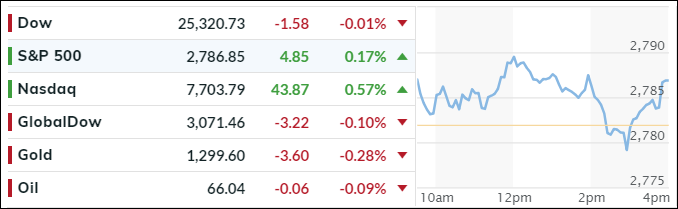
Not much mattered to the markets today, as the major indexes were stuck in a tight range with MSM seemingly ignoring or simply shrugging off the outcome of the historical meeting between Trump and Kim Jong Un.

Undeterred by the flat session, bullish momentum remains in place, despite recent events to the contrary, like, as one writer pointed out, “the US starting a global trade war, Italy electing a populist government, emerging markets descending into yet another crisis, and inflation rising from the dead – all of which would be expected to spook normal financial markets and send capital pouring into safe havens.”

Especially, on the inflation front, things start to look shaky, to say the least. Today’s release of the CPI met the consensus estimate of +0.2% MoM making the expected YOY number +2.8%, the highest since December 2011 while, at the same time, real wage growth slumped. Hmm, makes me wonder what ever happened to the Fed’s mandate of an upper 2% inflation limit?

Things were quiet on the interest rate front. After an early attempt to break the 10-year 3% yield ceiling, yields started to ease up, faded and ended the session unchanged.

All eyes are now on central bank meetings this week. First, the Fed is expected to raise interest rates tomorrow at the end of their 2-day discussions. This will be followed by the ECB on Thursday, when they are supposed to announce the timing of the unwinding of their bond purchases.

Read More