
- Moving the markets
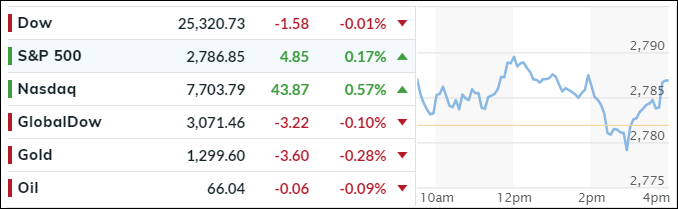
Not much mattered to the markets today, as the major indexes were stuck in a tight range with MSM seemingly ignoring or simply shrugging off the outcome of the historical meeting between Trump and Kim Jong Un.
Undeterred by the flat session, bullish momentum remains in place, despite recent events to the contrary, like, as one writer pointed out, “the US starting a global trade war, Italy electing a populist government, emerging markets descending into yet another crisis, and inflation rising from the dead – all of which would be expected to spook normal financial markets and send capital pouring into safe havens.”
Especially, on the inflation front, things start to look shaky, to say the least. Today’s release of the CPI met the consensus estimate of +0.2% MoM making the expected YOY number +2.8%, the highest since December 2011 while, at the same time, real wage growth slumped. Hmm, makes me wonder what ever happened to the Fed’s mandate of an upper 2% inflation limit?
Things were quiet on the interest rate front. After an early attempt to break the 10-year 3% yield ceiling, yields started to ease up, faded and ended the session unchanged.
All eyes are now on central bank meetings this week. First, the Fed is expected to raise interest rates tomorrow at the end of their 2-day discussions. This will be followed by the ECB on Thursday, when they are supposed to announce the timing of the unwinding of their bond purchases.
- ETFs in the Spotlight
In case you missed the announcement and description of this section, you can read it here again.
It features 10 broadly diversified and sector ETFs from my HighVolume list as posted every Saturday. Furthermore, they are screened for the lowest MaxDD% number meaning they have been showing better resistance to temporary sell offs than all others over the past year.
The below table simply demonstrates the magnitude with which some of the ETFs are fluctuating regarding their positions above or below their respective individual trend lines (%M/A). A break below, represented by a negative number, shows weakness, while a break above, represented by a positive percentage, shows strength.
For hundreds of ETF choices, be sure to reference Thursday’s StatSheet.
Year to date, here’s how our candidates have fared so far:
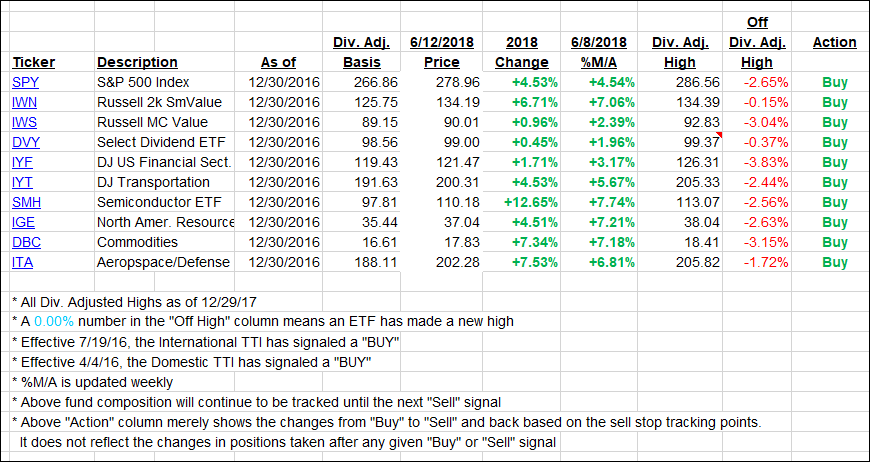
Again, the %M/A column above shows the position of the various ETFs in relation to their respective long-term trend lines, while the trailing sell stops are being tracked in the “Off High” column. The “Action” column will signal a “Sell” once the -7.5% point has been taken out in the “Off High” column.
- Trend Tracking Indexes (TTIs)
Our Trend Tracking Indexes (TTIs) were mixed with the Domestic one rising and the International one falling a tad.
Here’s how we closed 06/12/2018:
Domestic TTI: +2.88% above its M/A (last close +2.74%)—Buy signal effective 4/4/2016
International TTI: +2.02% below its M/A (last close +2.08%)—Buy signal effective 7/19/2016
Disclosure: I am obliged to inform you that I, as well as my advisory clients, own some of the ETFs listed in the above table. Furthermore, they do not represent a specific investment recommendation for you, they merely show which ETFs from the universe I track are falling within the guidelines specified.
Contact Ulli