
- Moving the markets
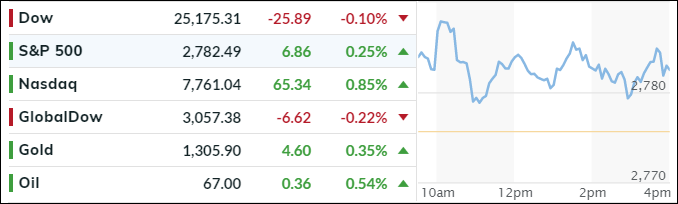
If you only watched the major indexes meandering around their respective unchanged lines and closing slightly in the green, except for the Dow, you missed out on the real action in some of the emerging markets.
The headlines did not cover equities but the wild activity in the foreign exchange markets (FX). The Bloomberg US Dollar index erupted to an 8-month high with UUP gaining +1.30%, which was its second largest gain YTD resulting in a huge tumble of the Euro, which had its biggest daily drop since the Brexit vote.
Emerging Market exchange rates got crushed, despite promises of intervention and other rescue efforts. However, nothing worked. Take a look at these charts demonstrating the demolishing of the Mexican Peso, Brazilian Real, Turkish Lira and Argentine Peso. (Hat tip goes to ZH for these charts).
Yet, domestically, all appeared calm as tech stock outperformed financials. Bonds rallied as yields retreated, after touching the 3% level yesterday, with the 10-year dropping 4 basis points to end the session at 2.94%.
Leave it to ZH to sum up this crazy day perfectly: “US stocks are higher, because European stocks are higher, because Draghi crushed the Euro, because he sees growth ending…”
It all makes perfect sense now…
- ETFs in the Spotlight
In case you missed the announcement and description of this section, you can read it here again.
It features 10 broadly diversified and sector ETFs from my HighVolume list as posted every Saturday. Furthermore, they are screened for the lowest MaxDD% number meaning they have been showing better resistance to temporary sell offs than all others over the past year.
The below table simply demonstrates the magnitude with which some of the ETFs are fluctuating regarding their positions above or below their respective individual trend lines (%M/A). A break below, represented by a negative number, shows weakness, while a break above, represented by a positive percentage, shows strength.
For hundreds of ETF choices, be sure to reference Thursday’s StatSheet.
Year to date, here’s how our candidates have fared so far:
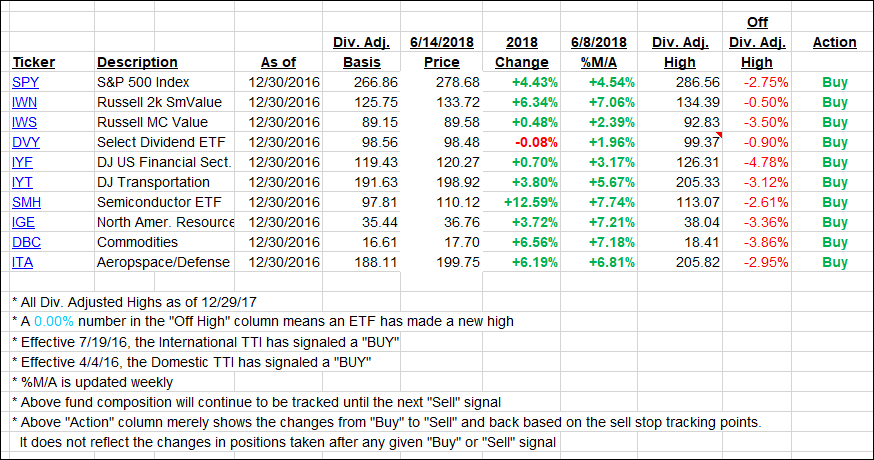
Again, the %M/A column above shows the position of the various ETFs in relation to their respective long-term trend lines, while the trailing sell stops are being tracked in the “Off High” column. The “Action” column will signal a “Sell” once the -7.5% point has been taken out in the “Off High” column.
- Trend Tracking Indexes (TTIs)
Our Trend Tracking Indexes (TTIs) were mixed again with the Domestic one gaining while the International one stumbled.
Here’s how we closed 06/14/2018:
Domestic TTI: +3.01% above its M/A (last close +2.76%)—Buy signal effective 4/4/2016
International TTI: +1.81% below its M/A (last close +2.00%)—Buy signal effective 7/19/2016
Disclosure: I am obliged to inform you that I, as well as my advisory clients, own some of the ETFs listed in the above table. Furthermore, they do not represent a specific investment recommendation for you, they merely show which ETFs from the universe I track are falling within the guidelines specified.
Contact Ulli