ETF Tracker Newsletter For June 29, 2018

Ulli ETF Tracker Contact

ETF Tracker StatSheet

https://theetfbully.com/2018/06/weekly-statsheet-for-the-etf-tracker-newsletter-updated-through-06-28-2018/

GAINING FOR THE DAY, LOSING FOR THE WEEK AND CLOSING MIXED YTD
[Chart courtesy of MarketWatch.com]
  1. Moving the markets

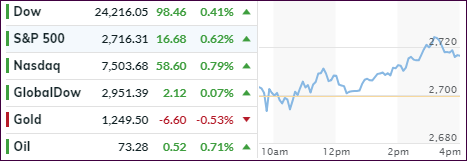
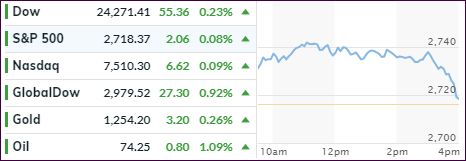
 An early rally flamed out as money managers squeezed in some quarter-ending window dressing causing volatility to the up- and downside, as the major indexes barely edged out some green numbers.

With the first half of 2018 now in the books, things did not turn out very well when considering that global stocks lost over $10 trillion. This chart demonstrates the distribution of winners and losers with the latter clearly leading, while the major indexes showed a mixed picture.

Domestically, YTD, the Dow lagged with -1.8%, followed by the S&P 500 (+1.7%), only thanks to a 2-day rebound yesterday and today. Taking top billing were the Nasdaq (+8.8%) and the Russell 2000 with +7.7%.

On the global stage, it appears that things have calmed down, at least for the moment, with China reportedly easing restrictions on foreign investment in certain sectors. Today, the EU leaders announced a deal over the crisis of migration, a tug-of-war that had been especially hard fought by the embattled German chancellor Merkel.

We’re now facing the second half of 2018 and future market performance will depend on a variety of conditions. These questions are on my mind currently:

  1. Can the economy continue to grow, or will it start sputtering as some reports suggest?
  2. Will employment conditions stay healthy with inflation being offset by wage growth?
  3. Will intended interest rate hikes be absorbed by a sufficiently growing economy?
  4. Will an EU banking crisis occur (Black Swan event) and can it be contained before spreading across the Atlantic?
  5. Will inflation accelerate to a point where rates need to rise sharply and affect stock markets negatively?

While no one has the answers, one thing is for sure. The second half promises to be anything but boring.
Read More

Weekly StatSheet For The ETF Tracker Newsletter – Updated Through 06/28/2018

Ulli ETF StatSheet Contact

ETF Data updated through Thursday, June 28, 2018

Methodology/Use of this StatSheet:

  1. From the universe of over 1,800 ETFs, I have selected only those with a trading volume of over $5 million per day (HV ETFs), so that liquidity and a small bid/ask spread are assured.
  2. Trend Tracking Indexes (TTIs)

Buy or Sell decisions for Domestic and International ETFs (section 1 and 2), are made based on the respective TTI and its position either above or below its long-term M/A (Moving Average). A crossing of the trend line from below accompanied by some staying power above constitutes a “Buy” signal. Conversely, a clear break below the line constitutes a “Sell” signal. Additionally, I use a 7.5% trailing stop loss on all positions in these categories to control downside risk.

  1. All other investment arenas do not have a TTI and should be traded based on the position of the individual ETF relative to its own respective trend line (%M/A). That’s why those signals are referred to as a “Selective Buy.” In other words, if an ETF crosses its own trendline to the upside, a “Buy” signal is generated. Since these areas tend to be more volatile, I recommend a wider trailing sell stop of 7.5% -10% depending on your risk tolerance.

If you are unfamiliar with some of the terminology, please see Glossary of Terms and new subscriber information in section 9.


  1. DOMESTIC EQUITY ETFs: BUY — since 4/4/2016

Click on chart to enlarge

Our main directional indicator, the Domestic Trend Tracking Index (TTI-green line in the above chart) is positioned above its long-term trend line (red) by +1.55% after having generated a new Domestic Buy signal effective 4/4/2016 as posted.

Read More

Financials And Tech Show Strength; International “Sell” Signal Confirmed

Ulli Market Commentary Contact

[Chart courtesy of MarketWatch.com]
  1. Moving the markets

Another slow start followed by a bounce back, which had legs for a change, gave the major indexes a victory session, although a modest one. Whether this was just another dead-cat bounce remains to be seen, but bullish momentum was not overwhelming thereby confirming our Domestic “Sell” signal affecting “broadly diversified international equity ETFs.”

I sold our last holding this morning, and we will not re-enter this arena until our International TTI (section 3) crosses solidly back above its long-term trend line.

All of Europe, except for Great Britain, got spanked and deep red was the preferred color on their stock exchanges. Domestically, the Dow’s troubles with its 200-day M/A continued as it closed the 4th day below it, which is not a good sign for the bullish crowd.

Scanning across markets, we see that the dollar slipped while Bond yields rose modestly. Foreign exchange markets (FX) showed a mixed picture with the Argentine Peso collapsing to a new low, while the Mexican Peso rallied ahead of elections. Not to be outdone, the Chinese Yuan continued its swan-dive like imitation by slumping for the 11th straight day.

Regarding domestic markets, we have simply been stuck in a trading range for the first half of this year. Look at this chart of the S&P 500:

Read More

From Feast To Famine: A Dead-Cat Bounce Dies

Ulli Market Commentary Contact

[Chart courtesy of MarketWatch.com]
  1. Moving the markets

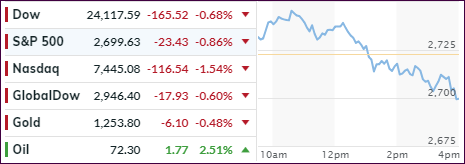
Follow through momentum from yesterday’s modest rebound ran into a brick wall mid-day, the bears took over and down we went with the major indexes diving decisively into the red and closing at the lowest level of June.

It sure looked like an early dead-cat bounce died suddenly and selling accelerated, as sentiment was influenced by the usual suspect, namely the ever-present anxiety over trade policy.

Only 3 of the primary S&P sectors ended on the plus side, while tech dropped -1.5%, which was followed by consumer discretionaries with -1.3%. The financial sector (-1.3%) set a new dubious record by extending the number of its successive daily declines to 13.

The Dow continued to bounce around its 200-day M/A but closed below it for the 3rd day as the VIX headed higher to top the 18 level. The massacre in Emerging Markets continued after a pausing for a few days, caused in part by a renewed surge in the US dollar with UUP gaining +0.60%.

Our International TTI slipped again and is confirming that the bears have won the battle for the time being. This indicator is now sitting -2.07% below its long-term trend line and therefore in bear market territory. As posted, I already liquidated some of our “broadly diversified international equity ETFs” and will sell the remaining balance tomorrow.

Again, I will watch the market action early on and, should there be a huge rebound in the making, I will hold off taking any action. Otherwise, the effective date for this international “Sell” signal will be 6/28/2018.

Read More

Trade Uncertainty Remains; Indexes Rebound Modestly

Ulli Market Commentary Contact

[Chart courtesy of MarketWatch.com]
  1. Moving the markets

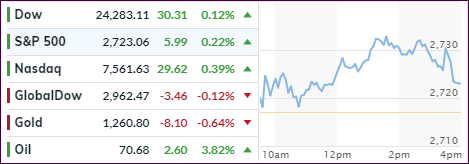
After Monday’s brutal sell-off, the major indexes managed to halt the bearish momentum by staging a modest rebound that peaked mid-day and then faded into the close. However, we ended the day with modest gains as cautious sentiment over trade policy remained on traders’ minds. To me, the session had the feel of a dead-cat bounce to it.

I consider this day an inconclusive one, as far as the status of our International TTI is concerned (see yesterday’s post). While I was looking for a sharp rebound to justify holding off with selling our international holdings, that did not materialize. On the other hand, more downside momentum would have confirmed our “Sell” signal, but that did not happen either.

In the end, I liquidated only 50% of our affected ETFs. I am now in a waiting position to see where there the markets go next. If the rebound continues, and our International TTI crosses back above its trend line, the “Sell” signal was a false one, and we will participate in the recovery with the remaining position. If, however, more downside weakness comes into play, it would confirm the “Sell,” and I will liquidate the leftover balance.

To be clear, the above only applies to “broadly diversified international ETFs.”

There was a lot of see-sawing going on in today’s session. While the major indexes stayed in the green all day, the Dow scrambled back above its 200-day M/A, only to lose it later in the day. The FANGs rebounded and so did the dollar. The odd man out was Crude Oil, which spiked and took out the $70/barrel level.

Traditionally, you could expect a quarter-ending rally for the next few days, as the window dressing factor comes into play but, with current global uncertainties, this is not a foregone conclusion.

Read More

More Trade Threats Rattle Markets; International TTI Moves Into Bear Market Territory

Ulli Market Commentary Contact

[Chart courtesy of MarketWatch.com]
  1. Moving the markets

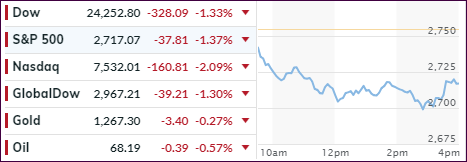
The trade war rhetoric continued unabated with the Chinese President now vowing that “no more turning the other cheek” was the new mantra. Equity markets finally got the hint that many things could change for the worse when it comes to global trading, and that there may be more losers than winners, contrary to early expectations.

The major indexes took a dive right after the opening bell and headed south for the entire session threatening to take a dive into the close. To limit the damage, Trump’s trade advisor emerged to utter some soothing words by saying “that there were no plans to impose investment restrictions,” contrary to Mnuchin’s view, “and that today’s slide is an overreaction.”

This halted downward momentum, and we saw a rebound during the last hour, with the Dow recovering some 100 points, to limit the damage. However, it did break below its 200-day M/A for the first time in 2 years. Looking at the bigger picture, the S&P 500 is still positioned slightly above of where we started the month and is remaining above its own 200-day M/A by +2.02%.

To sum it up, there was no place to hide. The tech sector got hammered, the US Dollar headed south, FANG stocks were freefalling, Europe gave back Friday’s gains, and the overall mood was simply, well, sour.

We’ll have to wait and see, if this down day was just an outlier or the beginning of more downside action. Recent activity seems to point to the latter, but you can’t be sure until it happens.

The immediate effect of today’s downward swing was reflected in the International TTI, which last week had already broken slightly below its trend line but bounced back to keep the bullish theme intact.

The break today was a sharp one with the International TTI ending up -1.36% below its trend line, which is a clear and decisive move. Again, I will play it the same way as last week.

If I see a sharp rebound tomorrow, I will hold off with taking any action. However, if there is continued weakness, I will take that as new “Sell” signal for “broadly diversified international ETFs” and liquidate the affected positions. Stay tuned!

Read More