Markets Gain Broadly As Geopolitical Tensions Wane

Ulli Market Commentary Contact

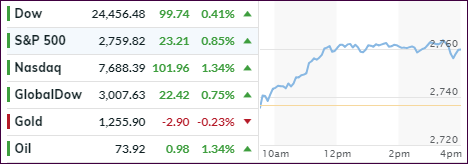
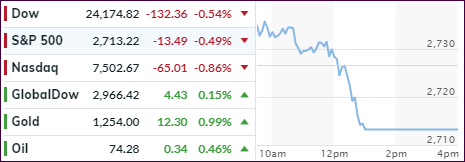
[Chart courtesy of MarketWatch.com]
  1. Moving the markets

By the time the opening bell rang this morning, the lobbing of a bunch of missiles into useless Syrian targets on Friday had been long forgotten with the focus now having shifted to the upcoming earnings season.

Everything appeared to be positive for the market with the S&P 500 honing in on its 50-day M/A, below which it has been stuck since March 9th. All of the 11 S&P sectors closed in the green. While BofAs earnings results exceeded expectations, the stock rose only +0.44%.

Interest rates showed a mixed picture with the 10-year bond yield coming down by 1 basis point to end the day at 2.83%. The US Dollar (UUP) gave back -0.34% and dipped below its 50-day M/A confirming bearish momentum.

With the Syrian debacle having died down, hopefully for good, and earnings season on deck, with great expectations, we should be able to break out of the current congestive sideways pattern and resume a more consistent upward trend. Only time will tell.

Read More

ETFs On The Cutline – Updated Through 04/13/2018

Ulli ETFs on the Cutline Contact

Below please find the latest High Volume ETFs Cutline report, which shows how far above or below their respective long-term trend lines (39 week SMA) my currently tracked ETFs are positioned.

This report covers the HV ETF Master List from Thursday’s StatSheet and includes 366 High Volume ETFs ETFs, defined as those with an average daily volume of more than $5 million, of which currently 193 (last week 125) are hovering in bullish territory. The yellow line separates those ETFs that are positioned above their trend line (%M/A) from those that have dropped below it.

Take a look:

The HV ETF Master Cutline Report

In case you are not familiar with some of the terminology used in the reports, please read the Glossary of Terms.

If you missed the original post about the Cutline approach, you can read it here.

ETF Tracker Newsletter For April 13, 2018

Ulli ETF Tracker Contact

ETF Tracker StatSheet

https://theetfbully.com/2018/04/weekly-statsheet-for-the-etf-tracker-newsletter-updated-through-04-12-2018/

 ENDING THE WEEK WITH A WHIMPER

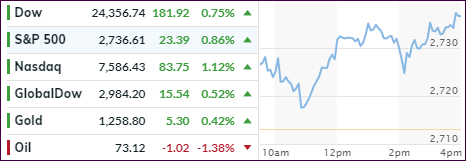
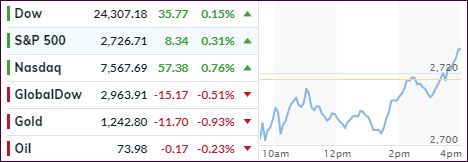
[Chart courtesy of MarketWatch.com]
  1. Moving the markets

The major indexes came under pressure and surrendered early gains as initial reads on the upcoming earnings season disappointed. Expectations have been high about corporate performance maybe in part due to the fact that geopolitical anxieties have painted a distorted picture.

While three major banks showed some better than anticipated report cards today, equities headed south anyway and pushed the financial sector down (XLF -1.51%). Still for the week, the Dow gained 2% while the S&P 500 and Nasdaq added 2.1% and 3% respectively.

Headline news ping-pong was in full swing today including such topics as China trade wars, Comey, Rosenstein, Mueller, Syria, Russia and slumping consumer sentiment, which were all adding to the general confusion in the market place rather than providing much needed clarity.

But, these are the roller-coaster times we live in, so we will continue to focus on the only reality we have, which is the major direction of the markets via our Trend Tracking Indexes (TTIs). The trend remains bullish, and we will stay on board until the bears gain the upper hand.

Read More

Weekly StatSheet For The ETF Tracker Newsletter – Updated Through 04/12/2018

Ulli ETF StatSheet Contact

ETF Data updated through Thursday, April 12, 2018

Methodology/Use of this StatSheet:

  1. From the universe of over 1,800 ETFs, I have selected only those with a trading volume of over $5 million per day (HV ETFs), so that liquidity and a small bid/ask spread are assured.
  2. Trend Tracking Indexes (TTIs)

Buy or Sell decisions for Domestic and International ETFs (section 1 and 2), are made based on the respective TTI and its position either above or below its long-term M/A (Moving Average). A crossing of the trend line from below accompanied by some staying power above constitutes a “Buy” signal. Conversely, a clear break below the line constitutes a “Sell” signal. Additionally, I use a 7.5% trailing stop loss on all positions in these categories to control downside risk.

  1. All other investment arenas do not have a TTI and should be traded based on the position of the individual ETF relative to its own respective trend line (%M/A). That’s why those signals are referred to as a “Selective Buy.” In other words, if an ETF crosses its own trendline to the upside, a “Buy” signal is generated. Since these areas tend to be more volatile, I recommend a wider trailing sell stop of 7.5% -10% depending on your risk tolerance.

If you are unfamiliar with some of the terminology, please see Glossary of Terms and new subscriber information in section 9.


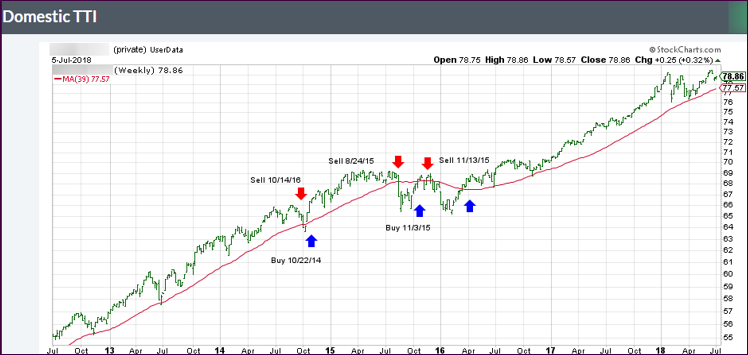
  1. DOMESTIC EQUITY ETFs: BUY — since 4/4/2016

Click on chart to enlarge

Our main directional indicator, the Domestic Trend Tracking Index (TTI-green line in the above chart) is positioned above its long-term trend line (red) by +1.48% after having generated a new Domestic Buy signal effective 4/4/2016 as posted.

Read More

Military Tensions Weaken—Markets Rally

Ulli Market Commentary Contact

[Chart courtesy of MarketWatch.com]
  1. Moving the markets

The tug-of-war continued today as talk, that a strike on Syria may not be immediately in the cards, de-escalated tensions and giving a bullish assist to equities. The 3 major indexes scored solid gains after yesterday’s losses.

Six out of the eleven primary S&P sectors gained led by Financials (XLF +1.75%) with Semiconductors (SMH +1.66%) taking second place.

While geopolitical concerns took center stage, Trump’s rhetoric softened from Wednesday’s “get ready Russia,” to Thursday’s “never said when an attack on Syria would take place. Could be very soon or not so soon at all!” In other words, he said absolutely nothing.

Besides the war mongering atmosphere, the markets still have trade sanctions with China to deal with and the upcoming earnings season, which is expected to be strong. In the meantime, the S&P has been dancing around its 200-day M/A successfully so far but has been trending sideways in a broad range.

In other words, we have some positives, negatives and a bunch of uncertainty, either of which will be able to affect market direction on any given day, hence the roller coaster environment. Should the negative factors overwhelm the positive ones, we may very well see our Trend Tracking Indexes (TTI) head south again, but it remains to be seen whether that downside momentum strengthens to a point where all-out “Sell” signals are being generated.

Stay tuned!

Read More

Geopolitical Tensions Push Markets Lower

Ulli Market Commentary Contact

[Chart courtesy of MarketWatch.com]
  1. Moving the markets

At least for one day, the U.S./China trade war battles were moved to the back burner, as geopolitical tensions dominated headline news, after tweets from President Trump that a military strike in Syria might be a possibility. That immediately ratcheted up verbal tensions with Russia, and the markets ended up being the fall guy by slipping into the close.

To me, most of this was just jawboning, after all, would you really want to announce an upcoming military strike? In any event, despite a mid-day attempt to conquer the unchanged line, downside momentum overwhelmed the bulls, and the major indexes closed modestly in the red.

Other data points had the CPI reports in line with expectations, while the minutes from the last Fed meeting included language suggesting that policy makers need to tap on the breaks of the economy. According to the Treasury, the government’s budget deficit was $209 billion in March, which was up 18% from the same month a year ago. Now that should have been headline news, but it was simply ignored. Go figure…

Interest rates slipped with the 10-year bond yield dropping 1 basis point to 2.79%. The US Dollar (UUP) continued its recent string of losses (-0.09%), while gold and crude oil bucked the trend by scoring solid gains.

Read More