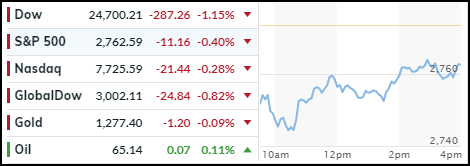
Massive Sell-Off Turns Into Solid Gains

Ulli Market Commentary Contact

[Chart courtesy of MarketWatch.com]
  1. Moving the markets

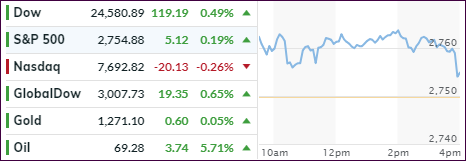
The chart above showing today’s rebound simply does not do justice to what actually happened. Right after the opening bell, the Dow plunged some 600 points only to begin a slow comeback and, along with the other major indexes, managed not only to recoup all early losses but turn the session into solid gains. In the end, the Dow traded in a range of some 840 points.

Causing this early turmoil was China’s announcement that it would slap tariffs on $50 billion of 106 billion of US imports. This was not really earthshaking news, as such possibility had been telegraphed a couple of weeks ago, but Wall Street’s short term memory would have none of that and down we went.

Igniting the rebound was the new kid on the block, namely Trump’s new National Economic Council director Larry Kudlow who said that “stock markets shouldn’t overreact to trade tensions between US and China because proposals by both countries are a first step and haven’t been implemented,” and offered even more soothing words by opining that “it is possible the tariffs will never come to pass.”

That was all it took, and the early dump turned into a successful pump. Needless to say, all red numbers vanished, and we closed solidly in the green with the S&P 500 regaining its 200-day M/A and the VIX dropping below 20. The 10-year bond yield remained unchanged, while the US Dollar went nowhere fast and gave back -0.04%.

While it’s been a wild ride this week, nothing has been gained or lost, because we’re just about back to the point (S&P) where we started. Let’s see if the next headlines have some more volatility surprises for us in store.

Read More

Tech Wreck Reverses

Ulli Market Commentary Contact

[Chart courtesy of MarketWatch.com]
  1. Moving the markets

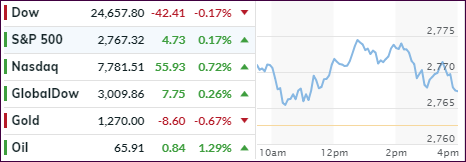
We started the session on a positive note, after yesterday’s drubbing, with the major indexes hovering above and slightly below their respective unchanged lines, as the beaten down tech sector showed signs of life. That caused me to hold off with my planned liquidation of one of our holdings, as we moved away from the trailing sell stop.

I also was watching the international ETFs very closely as my International TTI had slipped below its long term trend line, but only by a small margin (as I posted yesterday), which I considered inconclusive as far as the magnitude of the trend line break was concerned. That sector rallied as well, so no action was required on my part.

Early afternoon, as the S&P retreated off its highs and touched its unchanged line, out of nowhere, buyers appeared resulting in a buying panic to drive the indexes to session highs. What happened? Zerohedge describes it best:

It was generally a quiet day, with no macro news and equities range-bound, seemingly spooked by the ongoing verbal war between Trump and Jeff Bezos, where first in a tweet then a White House press conference, the president warned that US taxpayers will no longer subsidize Amazon “by the billions.” And, as has been the case recently, every time Trump spoke or tweeted, Amazon turned negative.

And then, just around 2:45pm, a Bloomberg headline hit, according to which  President Trump is not formally looking at options to address his concerns with Amazon, which immediately unleashed a buying panic first in Amazon and then across the broader market.

In my mind, the questions is whether Trump’s feud with Amazon will eventually run its course and subside, so Wall Street has one less thing to worry about and can push equities back towards all-time highs. Or, will Trump be the tough guy and risk a market meltdown? I guess we will find out soon.

Read More

Friday’s Melt-Up Evaporates As The Dead Cat Bounce Dies

Ulli Market Commentary Contact

[Chart courtesy of MarketWatch.com]
  1. Moving the markets

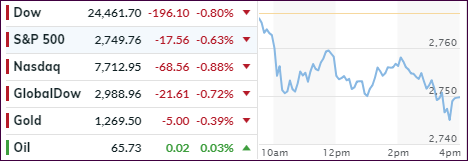
Friday’s month ending bounce-back is now in the rear view mirror as the floodgates opened this morning, and the major indexes headed straight south just about uninterruptedly until they found a support point this afternoon, which softened the damage for the day.

Nevertheless, chart damage was done with the S&P dropping below it’s widely watched 200-day M/A (-0.28%). This is the first time in about 18 months and generally a sign of weakening momentum that could invite further selling unless a quick bounce back recovers that level. That attempt fell short this afternoon.

There was simply no place to hide other than in gold. Tech took the lead down the elevator shaft again with FANGS getting hammered joined by bank stocks. Interest rates dropped with the 10-year bond yield hitting a two-month low at 2.73% while the US Dollar managed a slight rebound.

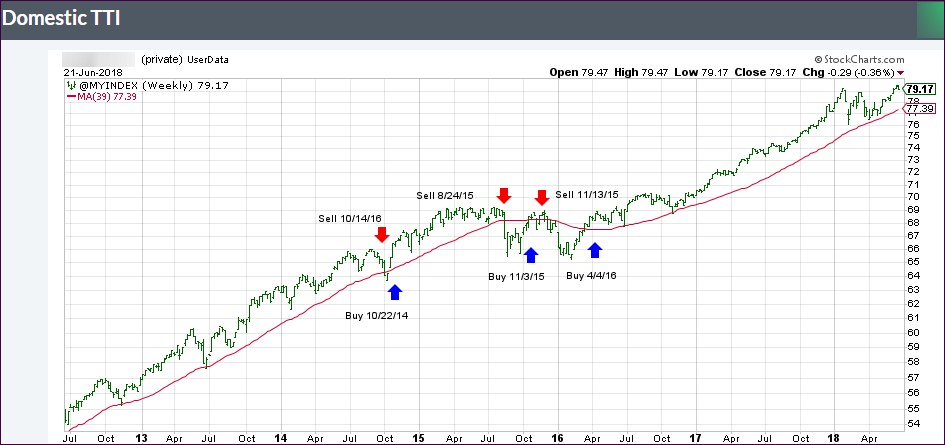
In terms of our Trend Tracking strategy, one of our trailing sell stops was triggered and will be liquidated tomorrow unless the markets stage a solid turnaround rally. The Domestic TTI has remained on the bullish side of its trend line but only by small margin. The International one has slipped barely below its own trend line, but by not enough of a margin to pull the trigger and declare this “Buy” cycle to be over.

However, we are very close. Should the markets show considerable weakness again tomorrow, I will then consider the International “Sell” to be validated and liquidate the appropriate holdings.

For details, please see section 3 below.

Read More

ETFs On The Cutline – Updated Through 03/29/2018

Ulli ETFs on the Cutline Contact

Below please find the latest High Volume ETFs Cutline report, which shows how far above or below their respective long-term trend lines (39 week SMA) my currently tracked ETFs are positioned.

This report covers the HV ETF Master List from Thursday’s StatSheet and includes 366 High Volume ETFs ETFs, defined as those with an average daily volume of more than $5 million, of which currently 173 (last week 109) are hovering in bullish territory. The yellow line separates those ETFs that are positioned above their trend line (%M/A) from those that have dropped below it.

Take a look:

The HV ETF Master Cutline Report

In case you are not familiar with some of the terminology used in the reports, please read the Glossary of Terms.

If you missed the original post about the Cutline approach, you can read it here.

Weekly StatSheet For The ETF Tracker Newsletter – Updated Through 03/29/2018

Ulli ETF StatSheet Contact

ETF Data updated through Thursday, March 29, 2018

Methodology/Use of this StatSheet:

  1. From the universe of over 1,800 ETFs, I have selected only those with a trading volume of over $5 million per day (HV ETFs), so that liquidity and a small bid/ask spread are assured.
  2. Trend Tracking Indexes (TTIs)

Buy or Sell decisions for Domestic and International ETFs (section 1 and 2), are made based on the respective TTI and its position either above or below its long-term M/A (Moving Average). A crossing of the trend line from below accompanied by some staying power above constitutes a “Buy” signal. Conversely, a clear break below the line constitutes a “Sell” signal. Additionally, I use a 7.5% trailing stop loss on all positions in these categories to control downside risk.

  1. All other investment arenas do not have a TTI and should be traded based on the position of the individual ETF relative to its own respective trend line (%M/A). That’s why those signals are referred to as a “Selective Buy.” In other words, if an ETF crosses its own trendline to the upside, a “Buy” signal is generated. Since these areas tend to be more volatile, I recommend a wider trailing sell stop of 7.5% -10% depending on your risk tolerance.

If you are unfamiliar with some of the terminology, please see Glossary of Terms and new subscriber information in section 9.


  1. DOMESTIC EQUITY ETFs: BUY — since 4/4/2016

Click on chart to enlarge

Our main directional indicator, the Domestic Trend Tracking Index (TTI-green line in the above chart) is positioned above its long-term trend line (red) by +1.28% after having generated a new Domestic Buy signal effective 4/4/2016 as posted.

Read More

A Broad Rally Ends A Poor Month

Ulli Market Commentary Contact

[Chart courtesy of MarketWatch.com]
  1. Moving the markets

A solid and broad rally right after the opening bell pulled the major indexes out of the doldrums with the bulls finally managing to reduce some of the losses sustained not only in March but YTD as well. Today’s leaders were the dogs of the month, namely tech and energy.

We’ll have to wait and see if the recent spanking of company’s like Facebook, Tesla, Twitter and Amazon will fade into the background come April or will be brought back on the front burner. But there were other culprits as well that contributed to weakness in equities, and those issues are far from being over. Global trade war concerns and a new Fed chairman, not afraid to raise rates at an accelerated pace, combined to bring stock prices down from their euphoric levels reached in 2017 and may continue to do so.

In the end, volatility and investor confusion have reach new heights but nobody can actually accurately forecast how this next quarter will play out. That’s why I believe it’s best to stick with our Trend Tracking strategy, which allows us to keep our emotions in check by only following the direction of the major trend along with our trailing sell stops. These two indicators will serve as our guide to calmly make buy/sell decisions especially when the market heat is on. This prevents us from making irrational moves when the media’s “headline hockey” game reaches ridiculous levels.

Read More