
- Moving the markets
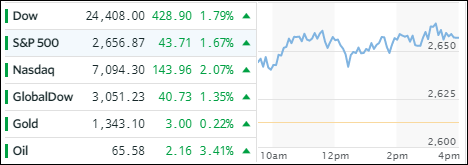
Unlike yesterday, when an early rally petered out, today’s sharply higher opening turned out to be the real thing, as equities maintained their upward momentum throughout the session and into the close, thereby scoring some solid gains across the board.
Giving the assist were Chinese President Xi Jinping’s suggestions to adopt a less-aggressive stance in regards to trade, which were exactly the words the markets were dying to hear, and off to the races we went. Headlines about trade issues between the two countries have been the biggest market influencer as of late driving stock markets sharply lower as well as contributing to massive rebounds.
Today’s gains were broad with 9 of the 11 S&P sectors closing green as Energy (+3.3%) and tech (+2.5%) occupied the top spots. The major indexes also managed to close up for 5 out of the last 6 sessions.
Apparently, there was nothing on the horizon to stop today’s market exuberance from spreading, as even Zuckerberg’s testimony in front of Congress was interpreted as positive with FB rallying +4.5% on the day. Yesterday’s fly in the ointment, namely the FBI’s raid on Trump’s personal lawyer, had no effect on market momentum.
While trade jawboning is sure to go on for months, and keep a cloud of uncertainty over the markets, I think that a less hard-nosed and more cooperative spirit will keep volatility in check unless, of course, sudden other hot spots take over the game of headline ping pong.
- ETFs in the Spotlight
In case you missed the announcement and description of this section, you can read it here again.
It features 10 broadly diversified and sector ETFs from my HighVolume list as posted every Saturday. Furthermore, they are screened for the lowest MaxDD% number meaning they have been showing better resistance to temporary sell offs than all others over the past year.
The below table simply demonstrates the magnitude with which some of the ETFs are fluctuating in regards to their positions above or below their respective individual trend lines (%M/A). A break below, represented by a negative number, shows weakness, while a break above, represented by a positive percentage, shows strength.
For hundreds of ETF choices, be sure to reference Thursday’s StatSheet.
Year to date, here’s how our candidates have fared so far:
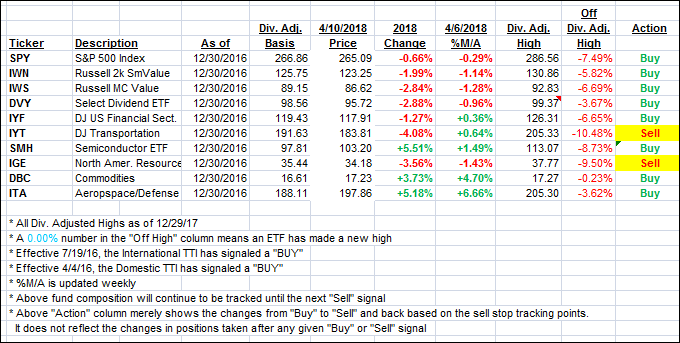
Again, the %M/A column above shows the position of the various ETFs in relation to their respective long term trend lines, while the trailing sell stops are being tracked in the “Off High” column. The “Action” column will signal a “Sell” once the -7.5% point has been taken out in the “Off High” column.
- Trend Tracking Indexes (TTIs)
Our Trend Tracking Indexes (TTIs) jumped as the major indexes scored solid gains.
Here’s how we closed 4/10/2018:
Domestic TTI: +1.38% above its M/A (last close +0.72%)—Buy signal effective 4/4/2016
International TTI: +1.99% below its M/A (last close +0.86%)—Buy signal effective 7/19/2016
Disclosure: I am obliged to inform you that I, as well as my advisory clients, own some of the ETFs listed in the above table. Furthermore, they do not represent a specific investment recommendation for you, they merely show which ETFs from the universe I track are falling within the guidelines specified.
Contact Ulli