
- Moving the markets
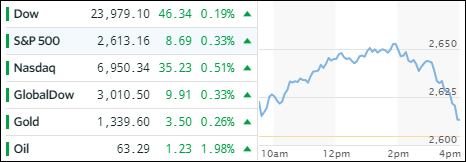
And it all looked so promising for the bulls this morning. The major indexes were broadly higher right after the opening bell when, about mid-day, things started to fall apart, and we were lucky to score any gains at all—thanks to the closing bell.
Driving the market early on were comments from Trump and other officials easing fears about the trade-war scare, which were offset by reports that the FBI had raided the offices of Michael Cohen, Trump’s personal lawyer. Some documents were seized that allegedly were related to payments to Stormy Daniels.
In the end, today’ round trip of 800 points for the Dow was nothing but a headline driven battle as the tug-of-war for headline domination continues. We’ll have to wait and see if that contest produces a winner or if the markets continue to be stuck in the current broad sideways trading pattern.
- ETFs in the Spotlight
In case you missed the announcement and description of this section, you can read it here again.
It features 10 broadly diversified and sector ETFs from my HighVolume list as posted every Saturday. Furthermore, they are screened for the lowest MaxDD% number meaning they have been showing better resistance to temporary sell offs than all others over the past year.
The below table simply demonstrates the magnitude with which some of the ETFs are fluctuating in regards to their positions above or below their respective individual trend lines (%M/A). A break below, represented by a negative number, shows weakness, while a break above, represented by a positive percentage, shows strength.
For hundreds of ETF choices, be sure to reference Thursday’s StatSheet.
Year to date, here’s how our candidates have fared so far:
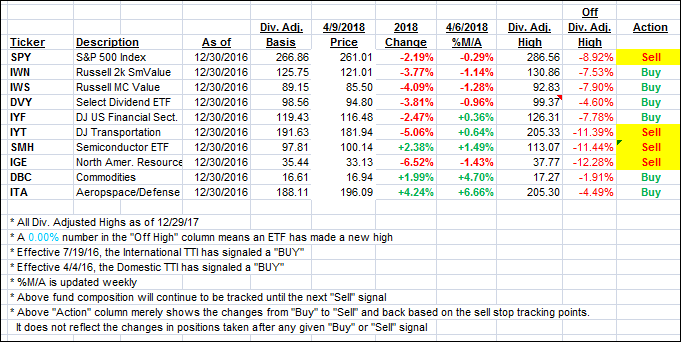
Again, the %M/A column above shows the position of the various ETFs in relation to their respective long term trend lines, while the trailing sell stops are being tracked in the “Off High” column. The “Action” column will signal a “Sell” once the -7.5% point has been taken out in the “Off High” column.
- Trend Tracking Indexes (TTIs)
Our Trend Tracking Indexes (TTIs) edged higher as the major indexes managed to eke out some gains.
Here’s how we closed 4/9/2018:
Domestic TTI: +0.72% above its M/A (last close +0.59%)—Buy signal effective 4/4/2016
International TTI: +0.86% below its M/A (last close +0.32%)—Buy signal effective 7/19/2016
Disclosure: I am obliged to inform you that I, as well as my advisory clients, own some of the ETFs listed in the above table. Furthermore, they do not represent a specific investment recommendation for you, they merely show which ETFs from the universe I track are falling within the guidelines specified.
Contact Ulli