
- Moving the markets
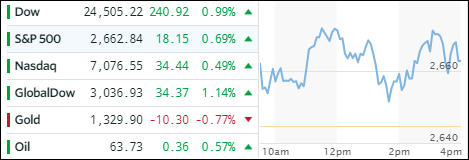
What a difference a day makes! As much as yesterday’s trade-war fears were the culprit contributing to the early market dump, today’s easing of those fears helped spark an early rally that continued the rebound and led to the Dow’s first 3-day win streak in a month.
While the early rally ran out of steam mid-day, and a sideways pattern pushed the major indexes around and off their highs, we ended up with solid gains.
The supporting actors, in the form of Trump’s trade chief Peter Navarro and Economic Council director Larry Kudlow appeared to offer more soothing words about the trade tensions. “There is still time to hash out a deal” and “the latest measures are just proposals right now” were exactly the things traders wanted to hear in order to sustain the positive market momentum.
While the gains were broad, the exception were Semiconductors (SMH), which were dragged down by one stock, namely Micron, which has been a recent darling in the hedge fund industry, but its 4% loss pulled down the entire sector.
Interest rates bounded off their recent lows with the 10-year bond yield gaining 4 basis points to end at +2.83%. That helped the US Dollar (UUP) gain +0.38% adding to recent advances and now having conquered its 50-day M/A again.
- ETFs in the Spotlight
In case you missed the announcement and description of this section, you can read it here again.
It features 10 broadly diversified and sector ETFs from my HighVolume list as posted every Saturday. Furthermore, they are screened for the lowest MaxDD% number meaning they have been showing better resistance to temporary sell offs than all others over the past year.
The below table simply demonstrates the magnitude with which some of the ETFs are fluctuating in regards to their positions above or below their respective individual trend lines (%M/A). A break below, represented by a negative number, shows weakness, while a break above, represented by a positive percentage, shows strength.
For hundreds of ETF choices, be sure to reference Thursday’s StatSheet.
Year to date, here’s how our candidates have fared so far:
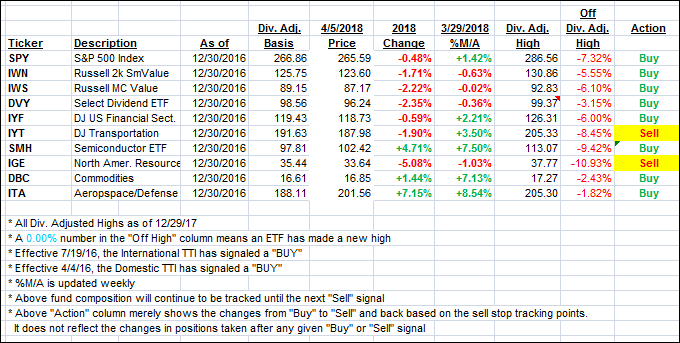
Again, the %M/A column above shows the position of the various ETFs in relation to their respective long term trend lines, while the trailing sell stops are being tracked in the “Off High” column. The “Action” column will signal a “Sell” once the -7.5% point has been taken out in the “Off High” column.
- Trend Tracking Indexes (TTIs)
Our Trend Tracking Indexes (TTIs) rallied as the bullish momentum continued.
Here’s how we closed 4/5/2018:
Domestic TTI: +1.53% above its M/A (last close +0.82%)—Buy signal effective 4/4/2016
International TTI: +1.54% below its M/A (last close +0.88%)—Buy signal effective 7/19/2016
Disclosure: I am obliged to inform you that I, as well as my advisory clients, own some of the ETFs listed in the above table. Furthermore, they do not represent a specific investment recommendation for you, they merely show which ETFs from the universe I track are falling within the guidelines specified.
Contact Ulli