ETFs On The Cutline – Updated Through 04/20/2018

Ulli ETFs on the Cutline Contact

Below please find the latest High Volume ETFs Cutline report, which shows how far above or below their respective long-term trend lines (39 week SMA) my currently tracked ETFs are positioned.

This report covers the HV ETF Master List from Thursday’s StatSheet and includes 366 High Volume ETFs ETFs, defined as those with an average daily volume of more than $5 million, of which currently 197 (last week 193) are hovering in bullish territory. The yellow line separates those ETFs that are positioned above their trend line (%M/A) from those that have dropped below it.

Take a look:

The HV ETF Master Cutline Report

In case you are not familiar with some of the terminology used in the reports, please read the Glossary of Terms.

If you missed the original post about the Cutline approach, you can read it here.

ETF Tracker Newsletter For April 20, 2018

Ulli ETF Tracker Contact


ETF Tracker StatSheet

https://theetfbully.com/2018/04/weekly-statsheet-for-the-etf-tracker-newsletter-updated-through-04-19-2018/

 HOBBLING INTO THE WEEKEND

[Chart courtesy of MarketWatch.com]
  1. Moving the markets

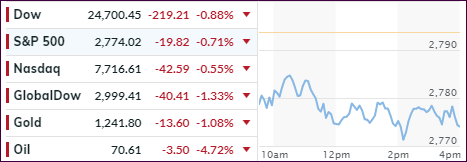
It was tough week with the major indexes struggling to not give back their gains made in the first 3 trading sessions. Even though we dumped into the weekend, stocks ended up in the green by a fraction of a percent.

All good things must come to an end eventually. This was the case with our favorite Semiconductor (SMH) holding, which had been dancing around its trailing sell stop for weeks.

As I mentioned yesterday, SMH had broken down and only a sharp rally this morning would have kept me from pulling the plug and exiting the position. The rally did not happen, and I liquidated.

This brings to an end a nice upward move over the past 14 months, which now allowed us to turn paper gains into real gains. To be clear, trailing sell stops are not just implemented to limit losses but also to take profits once a bullish movement has run its course and an ETF comes off its highs and drops past a pre-set percentage.

Helping to create the negative market sentiment were several actors. Technology and consumer staples showed weakness, which could not be overcome by the latest corporate earnings, despite them beating expectations.

I have long held the view that equities will be negatively affected once the 10-year bond yield crawls above 3%. While that did not happen yet, the previous old high of 2.94% (made in February) was taken out today with the yield hitting highs last seen in December 2014. That proved to be the nail in the coffin and down we went.

The rise in bond yields was attributed to higher inflation expectations. Had there been evidence of solid economic growth as a cause, we may have seen an accompanying rise in stocks. With the yield now knocking on the 3% level, we could see more downside in equities with the question remaining as to whether a crossing into 3% territory will bring about the demise of this current “Buy” cycle. Stay tuned!

Read More

Weekly StatSheet For The ETF Tracker Newsletter – Updated Through 04/19/2018

Ulli ETF StatSheet Contact

ETF Data updated through Thursday, April 19, 2018

Methodology/Use of this StatSheet:

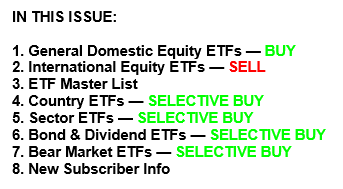
  1. From the universe of over 1,800 ETFs, I have selected only those with a trading volume of over $5 million per day (HV ETFs), so that liquidity and a small bid/ask spread are assured.
  2. Trend Tracking Indexes (TTIs)

Buy or Sell decisions for Domestic and International ETFs (section 1 and 2), are made based on the respective TTI and its position either above or below its long-term M/A (Moving Average). A crossing of the trend line from below accompanied by some staying power above constitutes a “Buy” signal. Conversely, a clear break below the line constitutes a “Sell” signal. Additionally, I use a 7.5% trailing stop loss on all positions in these categories to control downside risk.

  1. All other investment arenas do not have a TTI and should be traded based on the position of the individual ETF relative to its own respective trend line (%M/A). That’s why those signals are referred to as a “Selective Buy.” In other words, if an ETF crosses its own trendline to the upside, a “Buy” signal is generated. Since these areas tend to be more volatile, I recommend a wider trailing sell stop of 7.5% -10% depending on your risk tolerance.

If you are unfamiliar with some of the terminology, please see Glossary of Terms and new subscriber information in section 9.


  1. DOMESTIC EQUITY ETFs: BUY — since 4/4/2016
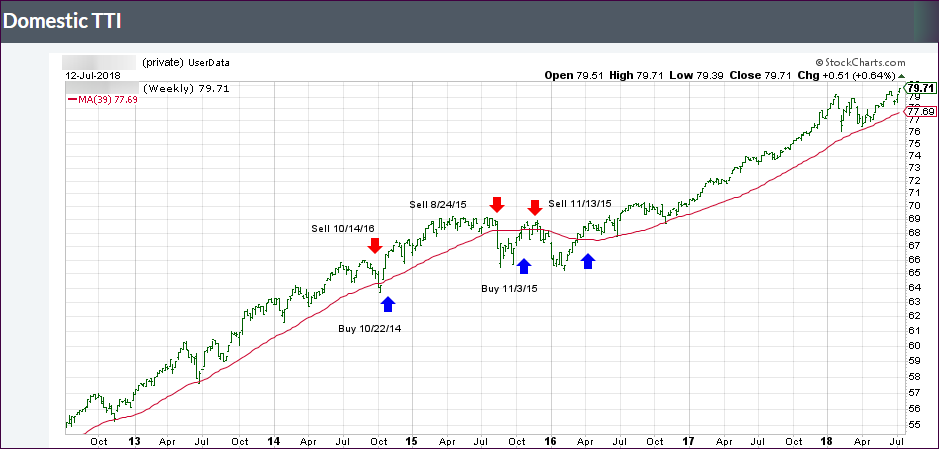
Click on chart to enlarge

Our main directional indicator, the Domestic Trend Tracking Index (TTI-green line in the above chart) is positioned above its long-term trend line (red) by +1.80% after having generated a new Domestic Buy signal effective 4/4/2016 as posted.
Read More

Tech Sector Pulls Down Stocks

Ulli Market Commentary Contact


[Chart courtesy of MarketWatch.com]
  1. Moving the markets

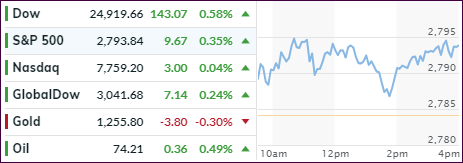
The 3-day really came to an end today with the major indexes pulling back but rallying off their session lows to limit damage. The late day rebound was the result of an announcement that Trump was told by Rosenstein that he was not the target of the Mueller investigation. That lifted the bullish spirits and sent stocks higher.

The technology sector stumbled with especially Semiconductors taking a hard hit with SMH dropping -4.46%, which brings it to within shouting distance of triggering its trailing sell stop. We’ve seen this scenario now several times over the past couple of months and each time SMH managed to recover. We’ll find out soon if this time will be different.

Earnings in general disappointed in other areas as well. Tobacco stocks got spanked, thanks to Philip Morris, and lost over 12%. Apple dropped almost 3%, not due to any announcements, but it was simply the casualty of a weak tech sector.

Financials (XLF +1.53%) outperformed most likely due to higher interest rates. The 10-year bond yield continued its recent snap-back and gained 5 basis points to end the session at 2.92%, a level last seen in mid-March. That caused the US Dollar to jump +0.30% back above its 50-day M/A.

Today’s reversal, after the smooth ride higher over the past 3 days, serves as a reminder that market conditions can change quickly, and that it is imperative not to become complacent but to remain alert and be prepared to deal with any directional changes that might come our way.

Read More

Hanging On To The Unchanged Line

Ulli Market Commentary Contact

[Chart courtesy of MarketWatch.com]
  1. Moving the markets

The Dow was the weakling of the day as IBM got spanked at the tune of -7.53%, which equaled a loss of 84 points on the Dow. We had a positive opening, followed by a dump and pump and a soft slide into the close with 2 out the three major indexes managing to end in the green by a tiny margin.

Energy (XLE) made up for some of the weak sectors by gaining +1.56% joined by Transportations (IYT +1.77%), whose performance is widely recognized as a bullish indicator. So far, banks are suffering despite good results with the Banking index (KRX) losing another -0.58% and honing in on early April lows. Financials (XLF) joined the club and gave back -0.44% despite solid earnings.

IBM was the center of attention with its sharp drop in stock price, which was its worst one-day decline since April 2013. Its earnings beat was the result of fancy accounting driven by a one-time tax gain.

In other news, the Fed’s Beige Book release did not affect markets, as its economic activity was shown to remain at a modest to moderate pace. Interest rates reversed and jumped with the 10-year bond yield gaining 5 basis points to end at 2.87%. So did the US Dollar (UUP) which, despite a volatile session, rose +0.21%.

Read More

Markets Pop On Earnings Cheers

Ulli Market Commentary Contact

[Chart courtesy of MarketWatch.com]
  1. Moving the markets

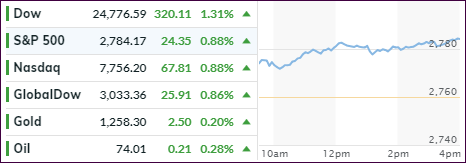
After yesterday’s solid gains, equities followed through with another session marked by bullish sentiment, as the major indexes piled on gains for the second straight day. The S&P 500 conquered its 50-day M/A to the upside and closed at a level last seen on March 19. The rally was broad with all 11 S&P sectors ending higher.

One supporting actor was the VIX, which dropped below 15, its lowest level since March 9. The VIX is a reflection of bullish and bearish option contracts. It moves opposite to stocks, meaning when it rallies, it creates a bearish environment for equities and vice versa.

Helping the markets was a positive view of first-quarter-earnings with growth expected to be some 17.3%, a number which we have not seen since 2011, although it’s uncertain how much of this is attributable to Trump’s recently passed tax bill. Everything was interpreted as a positive that even the underperformance of bank stocks, despite “blockbuster” Goldman Sachs earnings, could not put a dent in the session’s bullish trend.

Interest rates were lower with the 10-year bond yield giving back another basis point to close at 2.82%. The US Dollar (UUP) had a roller coaster day but ended unchanged.

In the end, assisting the markets as well was the fact that trade tensions with China did not worsen recently, which encouraged investors to maintain and add to equity exposure.

Read More