
- Moving the markets
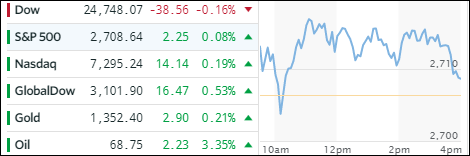
The Dow was the weakling of the day as IBM got spanked at the tune of -7.53%, which equaled a loss of 84 points on the Dow. We had a positive opening, followed by a dump and pump and a soft slide into the close with 2 out the three major indexes managing to end in the green by a tiny margin.
Energy (XLE) made up for some of the weak sectors by gaining +1.56% joined by Transportations (IYT +1.77%), whose performance is widely recognized as a bullish indicator. So far, banks are suffering despite good results with the Banking index (KRX) losing another -0.58% and honing in on early April lows. Financials (XLF) joined the club and gave back -0.44% despite solid earnings.
IBM was the center of attention with its sharp drop in stock price, which was its worst one-day decline since April 2013. Its earnings beat was the result of fancy accounting driven by a one-time tax gain.
In other news, the Fed’s Beige Book release did not affect markets, as its economic activity was shown to remain at a modest to moderate pace. Interest rates reversed and jumped with the 10-year bond yield gaining 5 basis points to end at 2.87%. So did the US Dollar (UUP) which, despite a volatile session, rose +0.21%.
- ETFs in the Spotlight
In case you missed the announcement and description of this section, you can read it here again.
It features 10 broadly diversified and sector ETFs from my HighVolume list as posted every Saturday. Furthermore, they are screened for the lowest MaxDD% number meaning they have been showing better resistance to temporary sell offs than all others over the past year.
The below table simply demonstrates the magnitude with which some of the ETFs are fluctuating in regards to their positions above or below their respective individual trend lines (%M/A). A break below, represented by a negative number, shows weakness, while a break above, represented by a positive percentage, shows strength.
For hundreds of ETF choices, be sure to reference Thursday’s StatSheet.
Year to date, here’s how our candidates have fared so far:
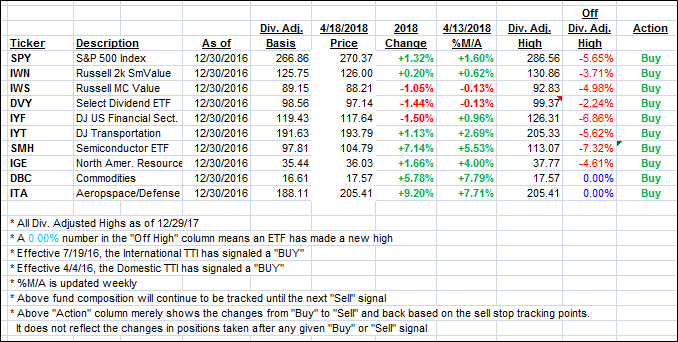
Again, the %M/A column above shows the position of the various ETFs in relation to their respective long term trend lines, while the trailing sell stops are being tracked in the “Off High” column. The “Action” column will signal a “Sell” once the -7.5% point has been taken out in the “Off High” column.
- Trend Tracking Indexes (TTIs)
Our Trend Tracking Indexes (TTIs) edged higher with especially the International one showing strong upward momentum.
Here’s how we closed 4/18/2018:
Domestic TTI: +2.12% above its M/A (last close +2.09%)—Buy signal effective 4/4/2016
International TTI: +3.11% below its M/A (last close +2.72%)—Buy signal effective 7/19/2016
Disclosure: I am obliged to inform you that I, as well as my advisory clients, own some of the ETFs listed in the above table. Furthermore, they do not represent a specific investment recommendation for you, they merely show which ETFs from the universe I track are falling within the guidelines specified.
Contact Ulli