
- Moving the markets
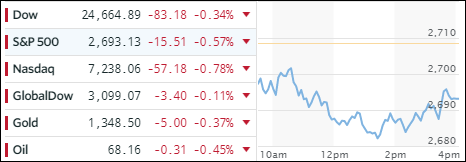
The 3-day really came to an end today with the major indexes pulling back but rallying off their session lows to limit damage. The late day rebound was the result of an announcement that Trump was told by Rosenstein that he was not the target of the Mueller investigation. That lifted the bullish spirits and sent stocks higher.
The technology sector stumbled with especially Semiconductors taking a hard hit with SMH dropping -4.46%, which brings it to within shouting distance of triggering its trailing sell stop. We’ve seen this scenario now several times over the past couple of months and each time SMH managed to recover. We’ll find out soon if this time will be different.
Earnings in general disappointed in other areas as well. Tobacco stocks got spanked, thanks to Philip Morris, and lost over 12%. Apple dropped almost 3%, not due to any announcements, but it was simply the casualty of a weak tech sector.
Financials (XLF +1.53%) outperformed most likely due to higher interest rates. The 10-year bond yield continued its recent snap-back and gained 5 basis points to end the session at 2.92%, a level last seen in mid-March. That caused the US Dollar to jump +0.30% back above its 50-day M/A.
Today’s reversal, after the smooth ride higher over the past 3 days, serves as a reminder that market conditions can change quickly, and that it is imperative not to become complacent but to remain alert and be prepared to deal with any directional changes that might come our way.
- ETFs in the Spotlight
In case you missed the announcement and description of this section, you can read it here again.
It features 10 broadly diversified and sector ETFs from my HighVolume list as posted every Saturday. Furthermore, they are screened for the lowest MaxDD% number meaning they have been showing better resistance to temporary sell offs than all others over the past year.
The below table simply demonstrates the magnitude with which some of the ETFs are fluctuating in regards to their positions above or below their respective individual trend lines (%M/A). A break below, represented by a negative number, shows weakness, while a break above, represented by a positive percentage, shows strength.
For hundreds of ETF choices, be sure to reference Thursday’s StatSheet.
Year to date, here’s how our candidates have fared so far:
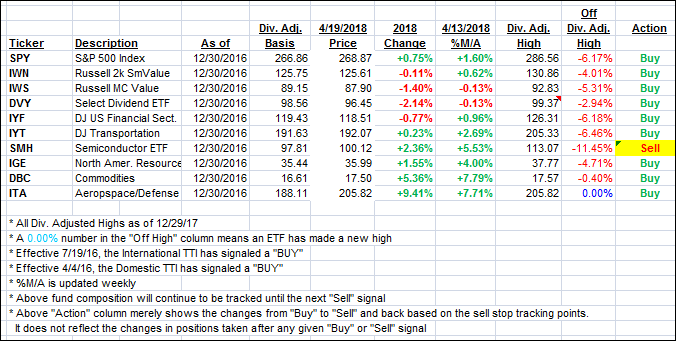
Again, the %M/A column above shows the position of the various ETFs in relation to their respective long term trend lines, while the trailing sell stops are being tracked in the “Off High” column. The “Action” column will signal a “Sell” once the -7.5% point has been taken out in the “Off High” column.
- Trend Tracking Indexes (TTIs)
Our Trend Tracking Indexes (TTIs) pulled back as the major indexes slipped.
Here’s how we closed 4/19/2018:
Domestic TTI: +1.80% above its M/A (last close +2.12%)—Buy signal effective 4/4/2016
International TTI: +2.83% below its M/A (last close +3.11%)—Buy signal effective 7/19/2016
Disclosure: I am obliged to inform you that I, as well as my advisory clients, own some of the ETFs listed in the above table. Furthermore, they do not represent a specific investment recommendation for you, they merely show which ETFs from the universe I track are falling within the guidelines specified.
Contact Ulli