
- Moving the markets
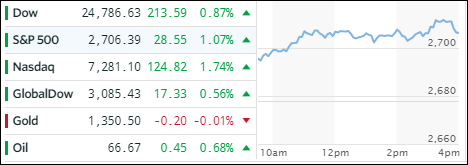
After yesterday’s solid gains, equities followed through with another session marked by bullish sentiment, as the major indexes piled on gains for the second straight day. The S&P 500 conquered its 50-day M/A to the upside and closed at a level last seen on March 19. The rally was broad with all 11 S&P sectors ending higher.
One supporting actor was the VIX, which dropped below 15, its lowest level since March 9. The VIX is a reflection of bullish and bearish option contracts. It moves opposite to stocks, meaning when it rallies, it creates a bearish environment for equities and vice versa.
Helping the markets was a positive view of first-quarter-earnings with growth expected to be some 17.3%, a number which we have not seen since 2011, although it’s uncertain how much of this is attributable to Trump’s recently passed tax bill. Everything was interpreted as a positive that even the underperformance of bank stocks, despite “blockbuster” Goldman Sachs earnings, could not put a dent in the session’s bullish trend.
Interest rates were lower with the 10-year bond yield giving back another basis point to close at 2.82%. The US Dollar (UUP) had a roller coaster day but ended unchanged.
In the end, assisting the markets as well was the fact that trade tensions with China did not worsen recently, which encouraged investors to maintain and add to equity exposure.
- ETFs in the Spotlight
In case you missed the announcement and description of this section, you can read it here again.
It features 10 broadly diversified and sector ETFs from my HighVolume list as posted every Saturday. Furthermore, they are screened for the lowest MaxDD% number meaning they have been showing better resistance to temporary sell offs than all others over the past year.
The below table simply demonstrates the magnitude with which some of the ETFs are fluctuating in regards to their positions above or below their respective individual trend lines (%M/A). A break below, represented by a negative number, shows weakness, while a break above, represented by a positive percentage, shows strength.
For hundreds of ETF choices, be sure to reference Thursday’s StatSheet.
Year to date, here’s how our candidates have fared so far:
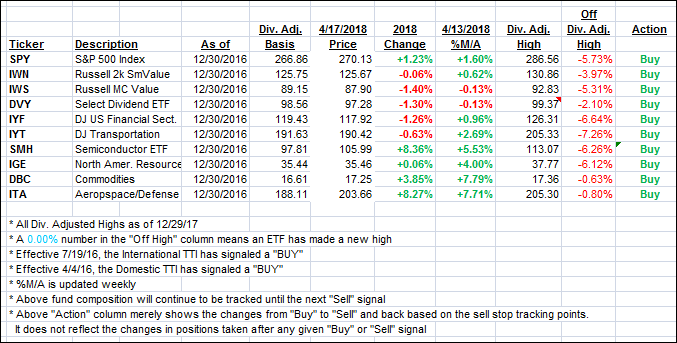
Again, the %M/A column above shows the position of the various ETFs in relation to their respective long term trend lines, while the trailing sell stops are being tracked in the “Off High” column. The “Action” column will signal a “Sell” once the -7.5% point has been taken out in the “Off High” column.
- Trend Tracking Indexes (TTIs)
Our Trend Tracking Indexes (TTIs) jumped as the bulls maintained the upper hand.
Here’s how we closed 4/17/2018:
Domestic TTI: +2.09% above its M/A (last close +1.51%)—Buy signal effective 4/4/2016
International TTI: +2.72% below its M/A (last close +2.05%)—Buy signal effective 7/19/2016
Disclosure: I am obliged to inform you that I, as well as my advisory clients, own some of the ETFs listed in the above table. Furthermore, they do not represent a specific investment recommendation for you, they merely show which ETFs from the universe I track are falling within the guidelines specified.
Contact Ulli