ETF Tracker Newsletter For April 27, 2018

Ulli ETF Tracker Contact

ETF Tracker StatSheet

https://theetfbully.com/2018/04/weekly-statsheet-for-the-etf-tracker-newsletter-updated-through-04-26-2018/

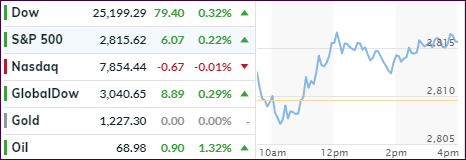
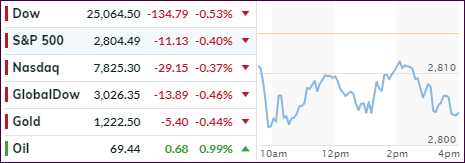
 LACKLUSTER SESSION KEEPS INDEXES IN CHECK

[Chart courtesy of MarketWatch.com]
  1. Moving the markets

A rising tide is supposed to lift all boats, but that was clearly not the case today. After yesterday’s strong earnings results from Amazon, Intel and Microsoft, you would have expected a follow through bullish day for the tech sector, which never happened.

After an early uptick, the markets vacillated around the unchanged line and ended up with the Dow in the red, the Nasdaq just about unchanged and the S&&P gaining a tad. It was dampened enthusiasm at its best despite the 3 players being involved representing some of the biggest and most influential companies in the world. Go figure…

Maybe Exxon’s tepid earnings report contributed to the lack of buying along with the latest GDP data. It showed that sharply slowing personal consumption had an effect as the Q4 2017 GDP number of 2.9% looks really good right now compared to the just released first quarter annualized GDP of 2.3%, which is the lowest in the past year.

None of these numbers confirm that the economy is rip-roaring but is decelerating with only some sectors showing strength. Even an assist in the form of the 10-year bond yield (2.96%) continuing to slide further away from the 3% marker had no influence on market behavior.

I think we are still stuck in a broad sideways pattern but we will, as is virtually a guarantee, break out at some point. The open ended question is whether it will be to the upside or to the downside. Only time will tell.

Read More

Weekly StatSheet For The ETF Tracker Newsletter – Updated Through 04/26/2018

Ulli ETF StatSheet Contact

ETF Data updated through Thursday, April 26, 2018

Methodology/Use of this StatSheet:

  1. From the universe of over 1,800 ETFs, I have selected only those with a trading volume of over $5 million per day (HV ETFs), so that liquidity and a small bid/ask spread are assured.
  2. Trend Tracking Indexes (TTIs)

Buy or Sell decisions for Domestic and International ETFs (section 1 and 2), are made based on the respective TTI and its position either above or below its long-term M/A (Moving Average). A crossing of the trend line from below accompanied by some staying power above constitutes a “Buy” signal. Conversely, a clear break below the line constitutes a “Sell” signal. Additionally, I use a 7.5% trailing stop loss on all positions in these categories to control downside risk.

  1. All other investment arenas do not have a TTI and should be traded based on the position of the individual ETF relative to its own respective trend line (%M/A). That’s why those signals are referred to as a “Selective Buy.” In other words, if an ETF crosses its own trendline to the upside, a “Buy” signal is generated. Since these areas tend to be more volatile, I recommend a wider trailing sell stop of 7.5% -10% depending on your risk tolerance.

If you are unfamiliar with some of the terminology, please see Glossary of Terms and new subscriber information in section 9.


  1. DOMESTIC EQUITY ETFs: BUY — since 4/4/2016

Click on chart to enlarge

Our main directional indicator, the Domestic Trend Tracking Index (TTI-green line in the above chart) is positioned above its long-term trend line (red) by +1.15% after having generated a new Domestic Buy signal effective 4/4/2016 as posted.

Read More

Tech Sector Pulls Markets Out Of The Doldrums

Ulli Market Commentary Contact

[Chart courtesy of MarketWatch.com]
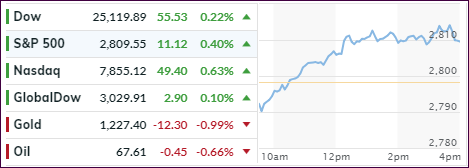
  1. Moving the markets

The tech sector took the lead during today’s rally, powered by FB’s strong results, which helped their shares to a solid +9.06% gain. While technology was the biggest gainer, 9 of the 11 primary S&P sectors finished higher. The loser of the day was telecommunications with -3.2%, which suffered due to AT&Ts poor results.

Interest rate concerns were pushed to the back burner as the 10-year bond yield slipped today and moved below its widely watched 3% level restoring a bit of calmness in the markets—at least for the time being. This benefited our Trend Tracking Indexes (TTI), which increased their safety margins to their M/As, meaning that a potential “Sell” signal is not imminent based on current numbers (see section 3 below).

While the tech sector appears to have found some footing, after it became clear that FB’s debacle of the last 45 days apparently did not affect their growth and user adoption, we might see some more upside over the next couple of days. That is until Apple Computers presents its report card on May 1. If their earnings are less than expected, thereby confirming recent stories about a reduction in demand, the tech euphoria might fade quickly.

Read More

Late Rally Wipes Out Early Losses

Ulli Market Commentary Contact

[Chart courtesy of MarketWatch.com]
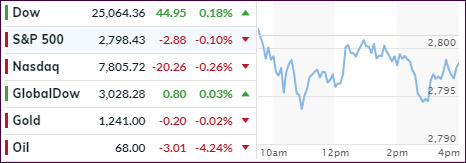
  1. Moving the markets

While rising bond yields continued to wreak havoc with the markets early on, a slow but steady climb, supported by strong corporate earnings and dip-buyers, proved to be saviors for the session by pushing the Dow and S&P 500 into the green by a small margin. The Nasdaq ended slightly lower, which was its 5th straight close to the downside, its longest in over a year.

Rising interest rates remain at the core of the problem for stocks with the 10-year bond yield now passing the 3% marker to reach a point last seen in December 2013. Again, if yields rise because of stronger economic growth that is not as worrisome as when they rise due to stronger inflation, which is the scenario we are in.

So far, the earnings season has been one with mixed results. More than 80% of the S&P companies who have reported have beaten forecasts. However, those results have not inspired enough confidence in Wall Street traders to go on a buying spree and push equities higher as general nervousness about the markets has prevailed.

Thanks to the rebound, our directional indicators, the Trend Tracking Indexes (TTIs), were not affected, and we remain in “Buy” mode—that is for the time being.

Read More

Equities Dump As Bond Yields Jump

Ulli Market Commentary Contact

[Chart courtesy of MarketWatch.com]
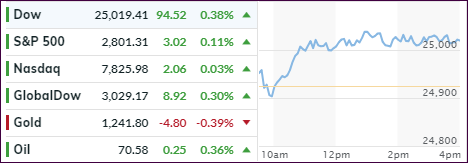
  1. Moving the markets

A quiet opening above the unchanged line suddenly turned into a rout with the major indexes tumbling and heading sharply south until dip buyers stepped in during the last hour to lessen the damage. The Industrial, material and technology sectors were most affected.

The culprit, as I have been posting about, was the 10-year bond yield, which spiked and briefly touched the psychologically important 3% level (first time in 4 years) without breaking it to the upside. Indeed, this event spooked the Wall Street crowd, as buyers were conspicuously absent, giving the bears an easy win over this session.

Higher interest rates and a sharp dive of -6.83% by 3M combined to push the Dow lower by over 400 points, which turned out to be the worst performance of the 3 major indexes. Even the results from the earnings season were interpreted as more negative than positive despite some report cards beating analysts’ forecasts. In other words, good earnings were simply not good enough to give an assist to equities.

While the 10-year bond yield pulled back to 2.979% after touching the 3% level, I think markets will remain shaky and in sell-off mode, unless bond yields head back south again, which appears questionable at this point. That brings into play a potential “Sell” signal for our Trend Tracking Indexes (TTIs).

Right now, there is still a little room to for the indexes to fall without affecting a trend line break to the downside (see section 3). However, considering the speed with which markets are moving, this could be just a matter of days—unless, of course, buyers find reasons to step up to the plate and exert their bullish forces.

Summing up the session best was economist David Rosenberg (Hat tip goes to ZH for this quote):

“I don’t know about anyone else, but I find it humorous that the stock promoters on bubble vision who told us heading into the peak that valuations don’t matter are now talking about how cheap the equity market is!”

Read More

Rising Bond Yields Kill Early Rally

Ulli Market Commentary Contact

[Chart courtesy of MarketWatch.com]
  1. Moving the markets

It was a mixed bag on the earnings front, as the latest reports can be best described as “so so,” which sent the major indexes initially higher but disappointment pulled the markets back below the unchanged line, with the exception of the S&P 500, which ended higher by a tiny fraction.

As I mentioned before, the 3% level of the 10-year bond yield will be a crucial point for equities. That became clear again today with weakness setting in as the yield surged towards that psychologically important marker but backed off prior to the end of the session saving equities from a sharper downturn. It now appears to be just a matter of time before we reach/cross that level which we last saw in January 2014.

Not helping matters was the fact that traders are now pricing in 4 interest rate hikes for 2018 rather than previously hoped for 3 increases.

The VIX pumped, dumped and pumped again helping the S&P 500 get back to its break-even point. Bank stocks tanked and FANGs stumbled, but the US Dollar (UUP) rallied for its 5th day in a row (crushing the shorts in the process) by gaining +0.63% and is now within spitting distance of conquering its 200-day M/A.

Read More