Due to a variety of business commitments, I won’t be able to write today’s market commentary.
Regular posting will resume tomorrow.

Due to a variety of business commitments, I won’t be able to write today’s market commentary.
Regular posting will resume tomorrow.
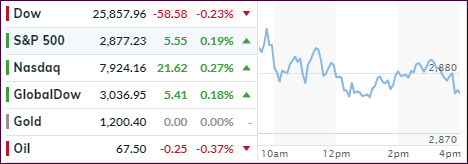
An early rally weakened mid-day with the Dow slipping back into the red, while the S&P 500 and Nasdaq showed more staying power and managed to end a 4-day losing streak, as the tech sector showed signs of life again. 9 of the 11 primary industry groups closed above the unchanged line making this ‘rebound’ a broad based one.
MarketWatch reminded us that “both the S&P and the Nasdaq are coming off four straight daily declines. Last week was the S&P’s first negative week of the past four, and it represented the biggest weekly percentage drop since June. The Nasdaq suffered its biggest weekly drop since March.” Given that, a bounce was overdue.
Despite the sell-off, we are still near all-time highs, but the causes of last week’s pullback remain the same. This is the time to be aware as to what’s going on not just in the financial arena but also on a global scale regarding unexpected events and whether they will have an immediate domini effect or possibly a delayed one. The Emerging Markets’ currency crisis is just one occurrence, that may not be spreading right now, but it will eventually.
Additionally, tariffs, trade disputes, interest rates, US dollar strength/weakness and economic data points are all moving parts that can combine forces and swing the pendulum from bullish to bearish at some point. The timing of this process is the challenging part, but our Trend Tracking Indexes (TTIs) will contribute in identifying the major trend of equities.
On the other hand, the see-saw effect of the past few weeks could very well blow over leading to much higher prices by the end of this year.
Below, please find the latest High-Volume ETF Cutline report, which shows how far above or below their respective long-term trend lines (39-week SMA) my currently tracked ETFs are positioned.
This report covers the HV ETF Master List from Thursday’s StatSheet and includes 366 High Volume ETFs ETFs, defined as those with an average daily volume of more than $5 million, of which currently 161 (last week 186) are hovering in bullish territory. The yellow line separates those ETFs that are positioned above their trend line (%M/A) from those that have dropped below it.
Take a look:
The HV ETF Master Cutline Report
In case you are not familiar with some of the terminology used in the reports, please read the Glossary of Terms.
If you missed the original post about the Cutline approach, you can read it here.
ETF Tracker StatSheet
MAJOR INDEXES LIMP LOWER FOR THE WEEK
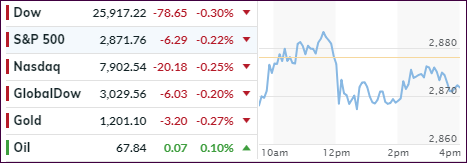
Even a decent jobs report showing that 201k jobs were added in August (vs. 200k expectations), along with a steady 3.9% unemployment rate, couldn’t stem the bearish tide. The major indexes lost for the week with Nasdaq faring the worst with -2.5%.
Bond yields jumped with the 10-year adding 6 basis points to 2.94% as inflation fears were stoked, because of the strongest growth in Average Hourly Earnings (AHE) in 9 years. This now has traders on edge with more interest hikes by the Fed now being a virtual certainty. A growing AHE, when combined with a humming economy, is interpreted as contributory to future inflation.
On the trade side of things, Trump upped the ante with China again when he announced that he is ready to not just greenlight the $200 billion in previously discussed tariffs but also impose another $267 billion that his administration is working on with the tariff rate being unknown so far.
Obviously, the fact that the July trade deficit with China reached an all-time high of $36.9 billion contributed to his decision. Even Apple Computers had to come out and admit that its products would be affected by tariffs causing the stock to drop sharply.
It’s been a rough start of the month for the markets, but after a summer of almost non-existent volatility, some changes were due to happen, and we’ll have to wait and see if this first week was simply an outlier or a harbinger of things to come.
ETF Data updated through Thursday, September 6, 2018

Methodology/Use of this StatSheet:
Buy or Sell decisions for Domestic and International ETFs (section 1 and 2), are made based on the respective TTI and its position either above or below its long-term M/A (Moving Average). A crossing of the trend line from below accompanied by some staying power above constitutes a “Buy” signal. Conversely, a clear break below the line constitutes a “Sell” signal. Additionally, I use a 7.5% trailing stop loss on all positions in these categories to control downside risk.
If you are unfamiliar with some of the terminology, please see Glossary of Terms and new subscriber information in section 9.
 Click on chart to enlarge
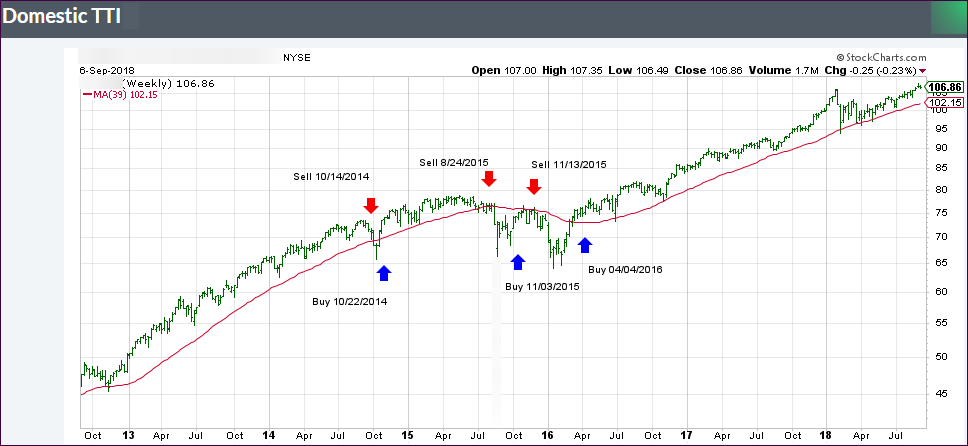
Our main directional indicator, the Domestic Trend Tracking Index (TTI-green line in the above chart) is positioned above its long-term trend line (red) by +4.83% after having generated a new Domestic Buy signal effective 4/4/2016 as posted.
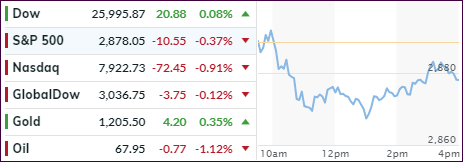
The major indexes headed south again led by continuing weakness in the tech sector. However, the Dow managed to buck the trend by ending in the green by a small margin. The S&P’s attempts to conquer the unchanged line were rebuffed, while the Nasdaq didn’t even come close to stage any kind of lasting rally and dropped -0.91%.
Not helping matters was softness in global markets with indexes in Europe and Asia heading south over mounting concerns that some of the struggling emerging markets may affect the economies of healthier EMs as well.
In focus today were Turkey and Argentina, whose currency followed the law of gravity, as confidence waned and spillover fears worsened. As I posted before, this drag will get worse, since no viable economic solutions appear to be on the horizon.
On the trade front, the jawboning with Canada intensified a notch, as Trump threw down the gauntlet by declaring that he is ready to move forward without Canada. Then there is the issue of the $200 billion in Chinese tariffs, which could be imposed as soon as this week.
Domestically, the FANG stocks headed south again for the 4th day in a row, its longest losing streak in 7 months.
I have talked much about the disconnect of various indicators. Here’s the latest update charting the S&P vs. the 30-year bond yield. As you can see, right now it appears that both are heading towards each other, and we may see a syncing soon. To be clear, this means that yields continue their path higher, with bond investors losing out. Why? When yields are rising, bond prices are falling.
On deck, and certainly capable of moving markets, is tomorrow’s jobs report. This promises to be an interesting event and, judging by today’s weak ADP numbers, expectations for 200k new jobs added in August, may be a little too optimistic.


