
- Moving the markets
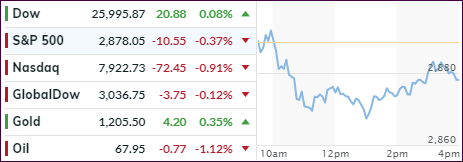
The major indexes headed south again led by continuing weakness in the tech sector. However, the Dow managed to buck the trend by ending in the green by a small margin. The S&P’s attempts to conquer the unchanged line were rebuffed, while the Nasdaq didn’t even come close to stage any kind of lasting rally and dropped -0.91%.
Not helping matters was softness in global markets with indexes in Europe and Asia heading south over mounting concerns that some of the struggling emerging markets may affect the economies of healthier EMs as well.
In focus today were Turkey and Argentina, whose currency followed the law of gravity, as confidence waned and spillover fears worsened. As I posted before, this drag will get worse, since no viable economic solutions appear to be on the horizon.
On the trade front, the jawboning with Canada intensified a notch, as Trump threw down the gauntlet by declaring that he is ready to move forward without Canada. Then there is the issue of the $200 billion in Chinese tariffs, which could be imposed as soon as this week.
Domestically, the FANG stocks headed south again for the 4th day in a row, its longest losing streak in 7 months.
I have talked much about the disconnect of various indicators. Here’s the latest update charting the S&P vs. the 30-year bond yield. As you can see, right now it appears that both are heading towards each other, and we may see a syncing soon. To be clear, this means that yields continue their path higher, with bond investors losing out. Why? When yields are rising, bond prices are falling.
On deck, and certainly capable of moving markets, is tomorrow’s jobs report. This promises to be an interesting event and, judging by today’s weak ADP numbers, expectations for 200k new jobs added in August, may be a little too optimistic.
- ETFs in the Spotlight
In case you missed the announcement and description of this section, you can read it here again.
It features 10 broadly diversified and sector ETFs from my HighVolume list as posted every Saturday. Furthermore, they are screened for the lowest MaxDD% number meaning they have been showing better resistance to temporary sell offs than all others over the past year.
The below table simply demonstrates the magnitude with which some of the ETFs are fluctuating regarding their positions above or below their respective individual trend lines (%M/A). A break below, represented by a negative number, shows weakness, while a break above, represented by a positive percentage, shows strength.
For hundreds of ETF choices, be sure to reference Thursday’s StatSheet.
Year to date, here’s how our candidates have fared so far:
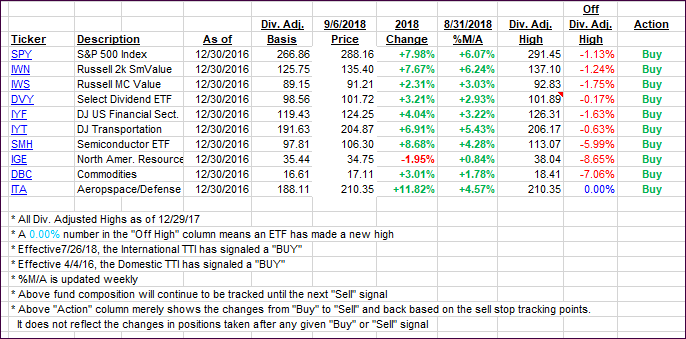
Again, the %M/A column above shows the position of the various ETFs in relation to their respective long-term trend lines, while the trailing sell stops are being tracked in the “Off High” column. The “Action” column will signal a “Sell” once the -8% point has been taken out in the “Off High” column. For more volatile sector ETFs, the trigger point is -10%.
- Trend Tracking Indexes (TTIs)
Our Trend Tracking Indexes (TTIs) both slipped as global mood favored the bearish crowd.
Here’s how we closed 09/06/2018:
Domestic TTI: +4.83% above its M/A (last close +5.02%)—Buy signal effective 4/4/2016
International TTI: -1.42% below its M/A (last close -1.31%)—Buy signal effective 7/26/2018
Disclosure: I am obliged to inform you that I, as well as my advisory clients, own some of the ETFs listed in the above table. Furthermore, they do not represent a specific investment recommendation for you, they merely show which ETFs from the universe I track are falling within the guidelines specified.
Contact Ulli