
- Moving the markets
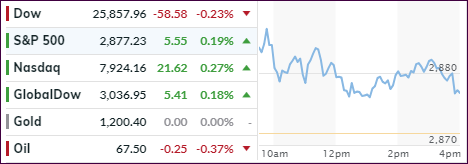
An early rally weakened mid-day with the Dow slipping back into the red, while the S&P 500 and Nasdaq showed more staying power and managed to end a 4-day losing streak, as the tech sector showed signs of life again. 9 of the 11 primary industry groups closed above the unchanged line making this ‘rebound’ a broad based one.
MarketWatch reminded us that “both the S&P and the Nasdaq are coming off four straight daily declines. Last week was the S&P’s first negative week of the past four, and it represented the biggest weekly percentage drop since June. The Nasdaq suffered its biggest weekly drop since March.” Given that, a bounce was overdue.
Despite the sell-off, we are still near all-time highs, but the causes of last week’s pullback remain the same. This is the time to be aware as to what’s going on not just in the financial arena but also on a global scale regarding unexpected events and whether they will have an immediate domini effect or possibly a delayed one. The Emerging Markets’ currency crisis is just one occurrence, that may not be spreading right now, but it will eventually.
Additionally, tariffs, trade disputes, interest rates, US dollar strength/weakness and economic data points are all moving parts that can combine forces and swing the pendulum from bullish to bearish at some point. The timing of this process is the challenging part, but our Trend Tracking Indexes (TTIs) will contribute in identifying the major trend of equities.
On the other hand, the see-saw effect of the past few weeks could very well blow over leading to much higher prices by the end of this year.
- ETFs in the Spotlight
In case you missed the announcement and description of this section, you can read it here again.
It features 10 broadly diversified and sector ETFs from my HighVolume list as posted every Saturday. Furthermore, they are screened for the lowest MaxDD% number meaning they have been showing better resistance to temporary sell offs than all others over the past year.
The below table simply demonstrates the magnitude with which some of the ETFs are fluctuating regarding their positions above or below their respective individual trend lines (%M/A). A break below, represented by a negative number, shows weakness, while a break above, represented by a positive percentage, shows strength.
For hundreds of ETF choices, be sure to reference Thursday’s StatSheet.
Year to date, here’s how our candidates have fared so far:
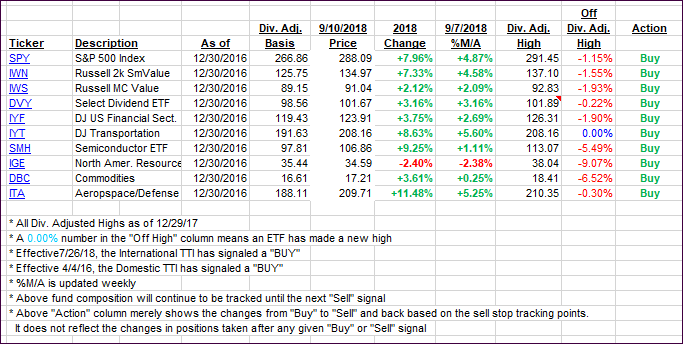
Again, the %M/A column above shows the position of the various ETFs in relation to their respective long-term trend lines, while the trailing sell stops are being tracked in the “Off High” column. The “Action” column will signal a “Sell” once the -8% point has been taken out in the “Off High” column. For more volatile sector ETFs, the trigger point is -10%.
- Trend Tracking Indexes (TTIs)
Our Trend Tracking Indexes (TTIs) showed some strength for the first time this month, as broad-based rally helped the bullish cause.
Here’s how we closed 09/10/2018:
Domestic TTI: +4.64% above its M/A (last close +4.25%)—Buy signal effective 4/4/2016
International TTI: -1.43% below its M/A (last close -1.67%)—Buy signal effective 7/26/2018
Disclosure: I am obliged to inform you that I, as well as my advisory clients, own some of the ETFs listed in the above table. Furthermore, they do not represent a specific investment recommendation for you, they merely show which ETFs from the universe I track are falling within the guidelines specified.
Contact Ulli