Climbing Out Of The Basement—Again

Ulli Market Commentary Contact

[Chart courtesy of MarketWatch.com]
  1. Moving the markets

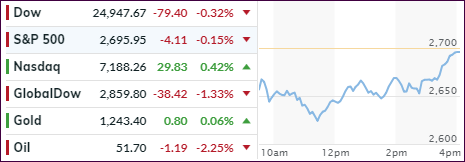
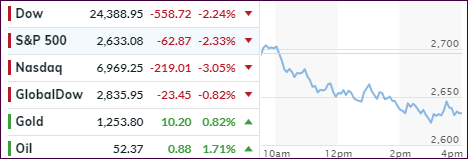
Stocks took an early dump to start the week, with the Dow being down at one point by 500 points, but a mid-day slow and steady rebound assisted the major indexes to slip back above the unchanged line by a moderate margin.

I can’t tell if the Plunge Protection Team (PPT) was at it again or if the recent adage “Sell the rally” was suddenly reversed with a “buy the dip” mentality but, after the sell-off we’ve seen, some hopeful bottom-fishers were simply bound to show up.

Intra-day, things did not look so good, as the S&P 500 took out its October low of 2,604 by touching the 2,583 level, which is in striking distance of the 2018 lows made back in February during the first crash of the year. Some projections are calling for new lows, should a close below the critical 2,616 number materialize.

The S&P’s death-cross was also confirmed. It simply means that the widely followed 50-day M/A crossed the below the 200-day M/A, which validates that we are locked in bear market territory, a position which our Domestic TTI has been signaling since 11/15/18.

European and Asian markets were not so lucky, as dip buyers were conspicuously absent punishing their major equity indexes. After Europe closed, US stocks started their levitation followed by a short squeeze helping the US markets being the only one with a green close.

Looking at the big picture, not all sectors fared well. SmallCaps tumbled again to their worst level since September 2017, while the Financials were suffering, as bank stocks collapsed for the 4th day in a row.

It goes to show you that a few green numbers are meaningless when most markets are trending lower confirming the current bearish bias. SMART money has recognized that by getting out of equities, as this chart clearly shows. The Globally Systemically Important Banks Stock (GSIB) Index is saying the same thing.

Until a new bullish theme is clearly confirmed, being on the sidelines makes the most sense, since a new “market puke” can occur suddenly and without warning.
Read More

ETFs On The Cutline – Updated Through 12/07/2018

Ulli ETFs on the Cutline Contact

Below, please find the latest High-Volume ETF Cutline report, which shows how far above or below their respective long-term trend lines (39-week SMA) my currently tracked ETFs are positioned.

This report covers the HV ETF Master List from Thursday’s StatSheet and includes 322 High Volume ETFs, defined as those with an average daily volume of more than $5 million, of which currently 51 (last week 69) are hovering in bullish territory. The yellow line separates those ETFs that are positioned above their trend line (%M/A) from those that have dropped below it.

Take a look:

The HV ETF Master Cutline Report

In case you are not familiar with some of the terminology used in the reports, please read the Glossary of Terms.

If you missed the original post about the Cutline approach, you can read it here.

ETF Tracker Newsletter For December 7, 2018

Ulli ETF Tracker Contact


[Chart courtesy of MarketWatch.com]

This is just a brief summary of today’s events, since I am down with a head cold.

Downward momentum picked up speed again today, after yesterday’s reprieve, with the major indexes plunging over 4.5% for the week, which was its worst weekly decline since March.

Despite the trade truce, Fed dovishness, and Canada cutting oil production, stocks got hammered even though the much anticipated jobs report was decent. In the end, we can only hope for the much talked about Santa Claus rally to get going soon, or it may not happen.

European markets were bleeding heavy, led by Germany, which was down over 6% from Monday’s highs.

Our Trend Tracking Indexes (TTIs) headed south with the Domestic one taking the lead to the downside.

Here’s how we closed 12/7/2018:

Domestic TTI: -4.62% below its M/A (last close -2.63%)—Sell signal effective 11/15/2018

International TTI: -6.18% below its M/A (last close -5.63%)—Sell signal effective 10/11/2018

Weekly StatSheet For The ETF Tracker Newsletter – Updated Through 12/06/2018

Ulli ETF StatSheet Contact

ETF Data updated through Thursday, December 6, 2018

Methodology/Use of this StatSheet:

  1. From the universe of over 1,800 ETFs, I have selected only those with a trading volume of over $5 million per day (HV ETFs), so that liquidity and a small bid/ask spread are assured.
  2. Trend Tracking Indexes (TTIs)

Buy or Sell decisions for Domestic and International ETFs (section 1 and 2), are made based on the respective TTI and its position either above or below its long-term M/A (Moving Average). A crossing of the trend line from below accompanied by some staying power above constitutes a “Buy” signal. Conversely, a clear break below the line constitutes a “Sell” signal. Additionally, I use a 7.5% trailing stop loss on all positions in these categories to control downside risk.

  1. All other investment arenas do not have a TTI and should be traded based on the position of the individual ETF relative to its own respective trend line (%M/A). That’s why those signals are referred to as a “Selective Buy.” In other words, if an ETF crosses its own trendline to the upside, a “Buy” signal is generated. Since these areas tend to be more volatile, I recommend a wider trailing sell stop of 7.5% -10% depending on your risk tolerance.

If you are unfamiliar with some of the terminology, please see Glossary of Terms and new subscriber information in section 9.


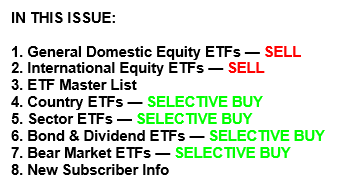
  1. DOMESTIC EQUITY ETFs: SELL — since 11/15/2018

 Click on chart to enlarge

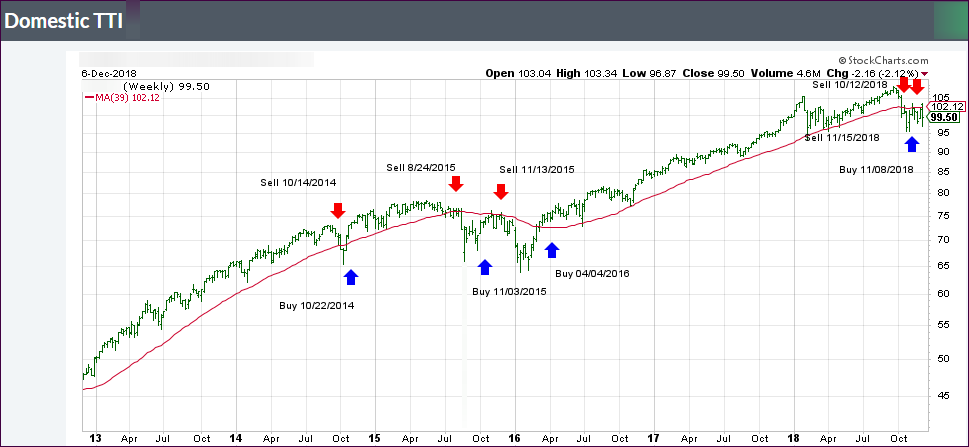
Our main directional indicator, the Domestic Trend Tracking Index (TTI-green line in the above chart) is now positioned below its long-term trend line (red) by -2.63% after having generated a new Domestic “Sell” signal effective 11/15/18 as posted.

Read More

An Early Dump Followed By A Mid-Day Pump

Ulli Market Commentary Contact

[Chart courtesy of MarketWatch.com]
  1. Moving the markets

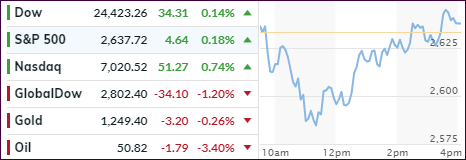
Global markets in general collapsed early on with the Dow at one point being down over 700 points, and that only after only 1.5 hours’ worth of trading. Contributing to the sour mood were news of the arrest of the chief financial officer of Chinese Telecom equipment maker Huawei.

Canadian officials arrested the CFO for potential extradition to the US for allegedly violating sanctions against Iran. While Meng Wanzhou was detained in Vancouver on Saturday, the news was only recently released, meaning that Trump and Xi had dinner at the G-20 meeting without this incident being made public, which sort of may have put another nail in the trade coffin.

European stocks joined that party and had their worst session in over 2 years with slumping oil prices adding to the declines. In the US, negative economic news, such as US factory orders tumbling the most in 15 months and initial jobless claims hovering at 6-month highs, were simply ignored in spite of softening indicators everywhere.

In the end, only the US markets managed a magical comeback (thanks to the Plunge Protection Team?) with the major indexes climbing steadily from mid-day on. While the Nasdaq managed to close in the green, the Dow and S&P 500 cut their sharp early losses as well and ended in the red by an insignificant margin. Helping the rebound was a well-timed article by the WSJ indicating that the Fed might not hike in December.

Our Trend Tracking Indexes (TTIs) remain in bear market territory, and we’re out of the market for the time being (since 11/15/18).

Read More

One-Two Punch Knocks Down Markets

Ulli Market Commentary Contact

[Chart courtesy of MarketWatch.com]
  1. Moving the markets

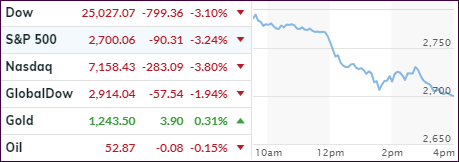
As I pointed our yesterday, sudden up moves can be ephemeral in nature, and even more so when they are based on hope and hot air. This is what we saw today when the nothing-burger, AKA the Trump-Xi non-deal, came back with a vengeance and collapsed the major indexes by over 3%.

Trump confirmed that the trade war is not over, while renaming himself to “Tariff Man.” Really, I am not making this up. In other words, we went from the exuberant truce to brutal realty for the markets in just about one day, which also means the hard-fought gains from the Powell dovishness and the trade cease-fire have just about disappeared.

The major indexes have now crashed back below key technical support levels into bearish territory with Transportations and SmallCaps slipping back into the red YTD.

The second punch of the day came from the interest rate arena, as key yield curves hit the flattest in 11 years with the 3-year and 5-year note inverting for the first time since 2007. What that simply means is that short-term interest rates are higher than long-term ones. The inversion of the 2-year and 10-year, which we are close to, has always been an accurate predictor of recessions.

Yesterday’s small move above the trend line in our Domestic Trend Tracking Index (TTI-section 3), has been reversed, and we are back in alignment with our current model, which shows that we are in bear market territory and therefore have no exposure to equity ETFs (since 11/15/18).

The question in my mind now is whether the markets will head further south and test the October lows, or if magically a year-end rally will materialize. While I have always considered the latter a real possibility, today’s brutal sell-off leaves the future direction wide open.

Right now, it’s good to be on the sidelines…

Read More